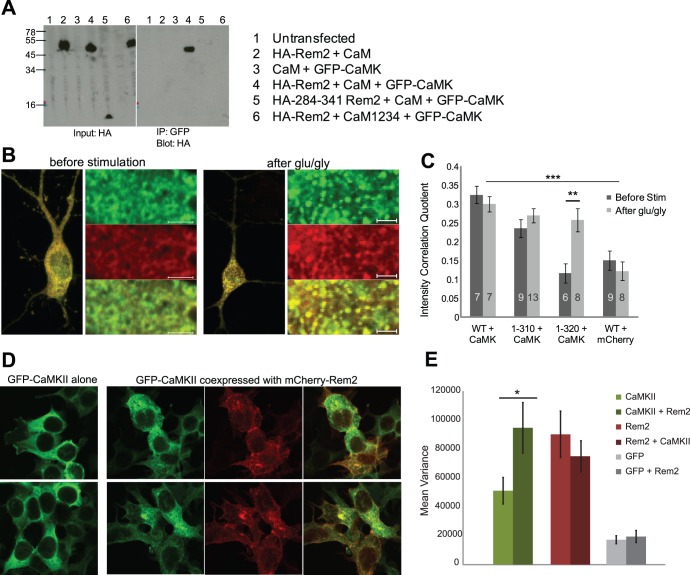
Figure 5. Rem2 interacts and redistributes with CaMKII.
(A) Calcium-calmodulin is essential for Rem2-CaMKII association. HEK cells were transfected with the indicated GFP-CaMKII, CaM, the calcium-insensitive mutant CaM1234 or HA-Rem2 constructs. Cell lysates were coprecipitated with anti-GFP antibody coupled to proteinA/G beads. Coprecipitated proteins were eluted from beads in sample buffer and separated using 10%/16% tricine SDS-PAGE followed by Western blotting with anti-HA antibody. Precleared lysates (left) and coprecipitated proteins (right) are shown. CaMKII binds only to full length Rem2 (lane 4) and not to a C-terminal fragment of Rem2 (lane 5). CaMKII also shows no binding when Rem2 and CaMKII are coexpressed with CaM1234 (lane 6). (B) Fluorescent signals of GFP-Rem2 and mCherry-CaMKII redistribute together. Rem2 and CaMKII cotransfected neurons were fixed following no stimulation or 60 seconds of 100 µM glutamate/10 µM glycine stimulation and 5 minutes of recovery. Left subpanel of each panel shows a cell coexpressing CaMKII and Rem2. Right subpanel shows a higher resolution of the subcellular distribution of GFP-Rem2 (top), mCherry-CaMKII (center) and an overlay (bottom). Scale bars are 5 µm. (C) Rem2 and CaMKII are colocalized before (dark bars) and after (light bars) stimulation. Intensity correlation of GFP and mCherry signal is given for neurons coexpressing mCherry-CaMKII and GFP-Rem2 wild-type or C-terminal truncations. The higher the intensity correlation quotient (ICQ), the greater the covariance of the two colors across the cell, i.e. higher colocalization within the cell. Correlation of GFP-WT Rem2 and unconjugated mCherry is given as control. ICQ of GFP-WT-Rem2+ mCherry-CaMKII before stimulation, 0.312±0.015; GFP-WT-Rem2+ mCherry alone, 0.137±0.018; two-way ANOVA, p<0.001. Only the constitutively punctate 1–320 Rem2 mutant shows a different distribution from CaMKII before stimulation, although it correlates with CaMKII after. Before stimulation, 0.117±0.026; after stimulation, 0.258±0.030; t-test, p = 0.004. (D) Rem2 alters basal CaMKII distribution. HEK cells expressing GFP-CaMKII alone (left panels) or GFP-CaMKII coexpressed with mCherry-Rem2 (right panels) were fixed and imaged using confocal microscopy. Note the diffuse distribution of GFP-CaMKII when Rem2 is absent. (E) Rem2 alters CaMKII distribution. Mean pixel intensity variance in fixed HEK cells of GFP-CaMKII (alone, 51106±9158, N = 69; with Rem2, 94591±17452, N = 56), mCherry-Rem2 (alone, 90085±16053, N = 60; with CaMKII 74948±10689, N = 60) or GFP fluorescence (alone, 17232±2775, N = 60; with Rem2, 19442±4145, N = 57).

