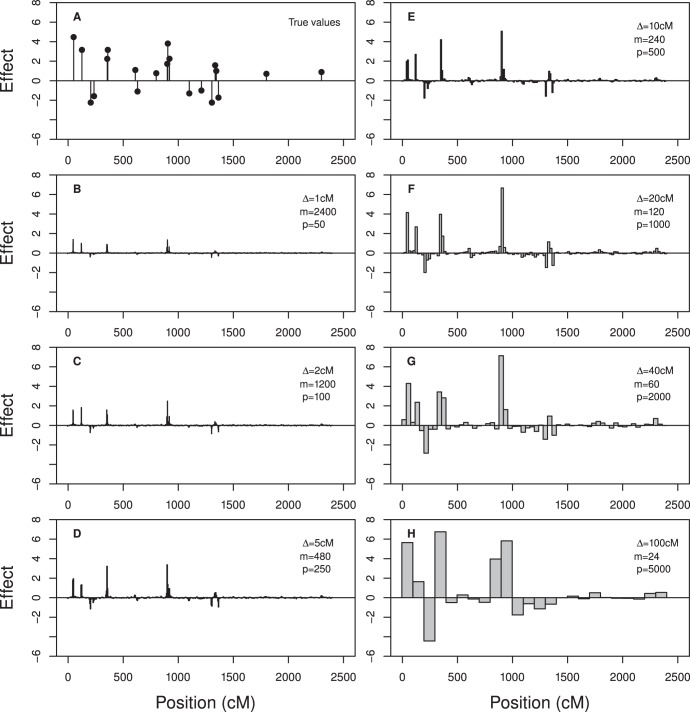
Figure 1. True QTL effects and estimated bin effects for design I.
The bin effect estimates were obtained from 100 replicated simulations. The total number of markers was 120,001. The sample size was  . The pure environmental error variance was
  . The 20 simulated QTL collectively explained 0.581 of phenotypic variance. The three symbols represent the size of bin (
 ), the number of markers (model dimension) within a bin (m) and the number of markers per bin (
 ). Since the bin size and number of markers per bin are constant across bins, the subscript k has been removed from the figure legends.

