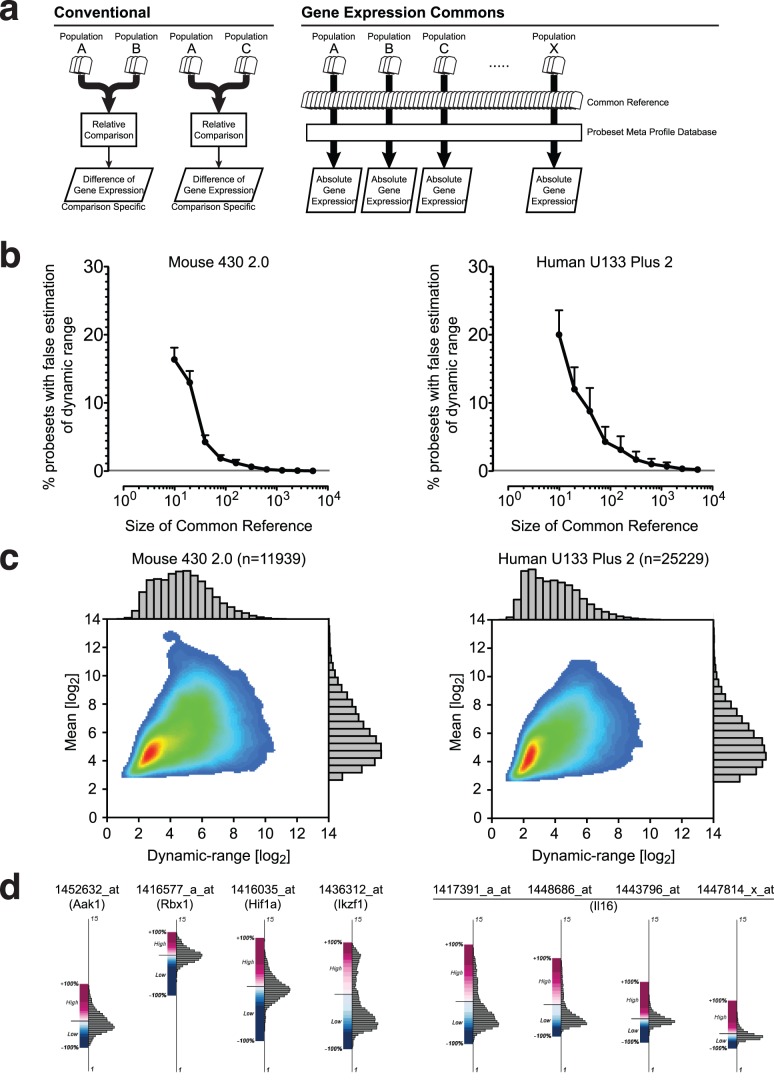
Figure 1. Absolute gene expression profiling with a large-scale common reference and a probeset meta profile database.
(A) Relative vs. absolute gene expression profiling. Conventional methods compare differences in gene expression between samples within an individual experiment, and result in relative values only (left). In Gene Expression Commons, raw microarray data is individually normalized against a large-scale common reference, then mapped onto the probeset meta profile. This strategy enables profiling of absolute expression levels of all genes on the microarray (right). (B) Relationship between the size of the common reference and the accuracy of the probeset dynamic range estimation. The result of one out of five experiments is shown. The Y-axis represents % probesets with false estimation of dynamic range in mean ± S.E.M (n = 10). (C) The dynamic range versus the mean of each probeset in Affymetrix Mouse 430 2.0 (n = 11,939) (left) and Affymetrix Human U133 Plus 2 (n = 25,229) (right) presented by a density plot and histograms. (D) Graphical representation of probeset meta profile. The Y-axis represents expression intensity without units in log2 scale. The distribution of expression levels is displayed by a histogram (right side of the axis). The high/low threshold computed is shown by a solid bar, and the distribution of percentiles in either the high or low expression range is indicated by a gradation of color, displayed as highest (+100%) in dark red, threshold (0%) in white, lowest (−100%) in dark blue (left side of the axis). Four diverse distributions of probesets for four different genes (Aak1, Rbx1, Hif1a and Ikzf1) (left), and diverse distribution of four probesets of one gene (Il16) (right) are shown.

