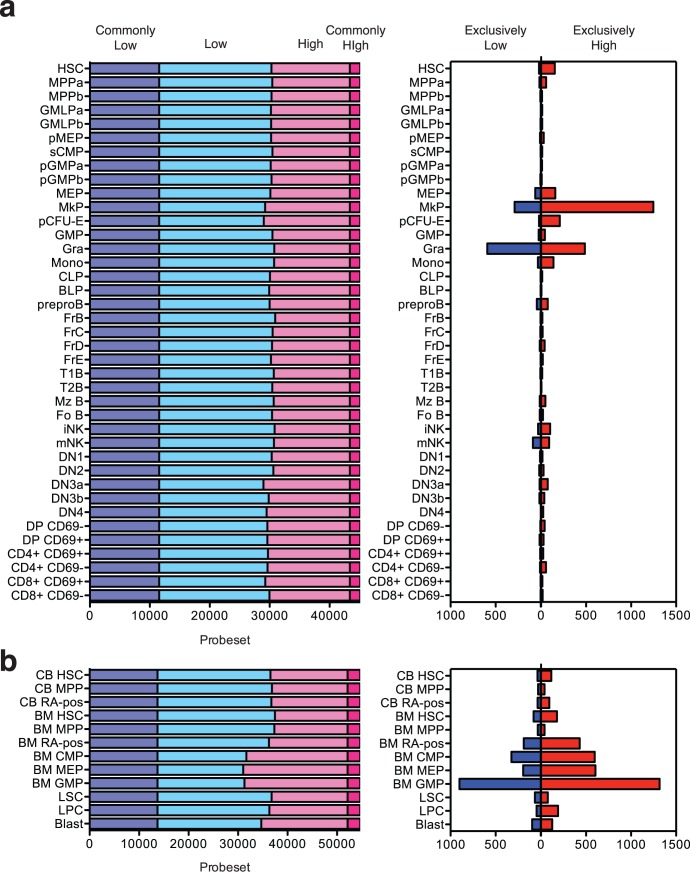
Figure 3. Gene expression pattern profiling of mouse and human hematopoiesis.
Number of genes expressed at very low levels (dark blue), low levels (light blue), high levels (light red) and very high levels (dark red) in either the Mouse Hematopoiesis Model (A, left) or Human Hematooiesis Model (B, left). Number of genes expressed at high (red) and low (blue) levels in a specific population in Mouse Hematopoiesis Model (A, right) and Human Hematopoiesis Model (B, right). A list of genes matching each criterion can be obtained with a few clicks on Gene Expression Commons (https://gexc.stanford.edu/).

