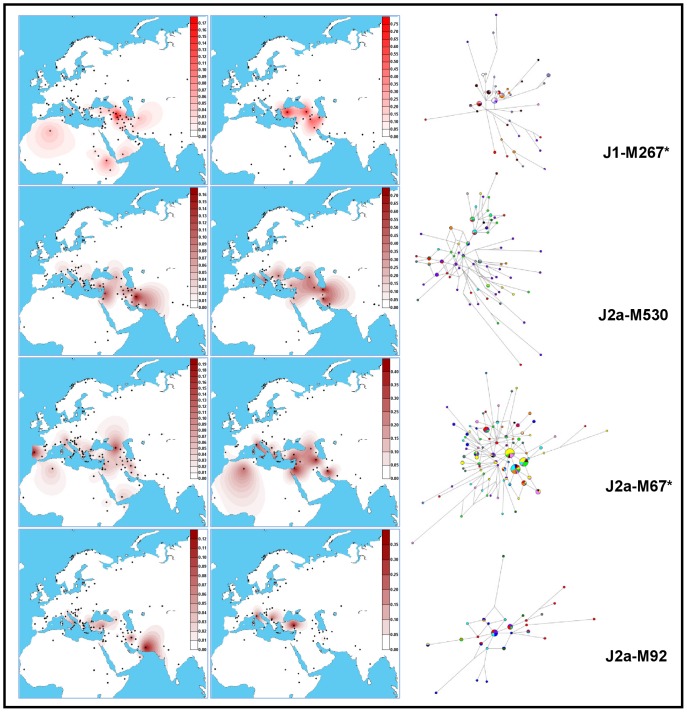
Figure 2. Frequency and variance distributions of haplogroup J lineages observed in Iran together with the relative networks of the associated STR haplotypes.
Left panels: frequency distributions; central panels: variance distributions; right panels: networks. The areas of circles and sectors are proportional to the haplotype frequency in the haplogroup and in the geographic area, respectively, (for details about the colours, see Figures S2, S3, S4).

