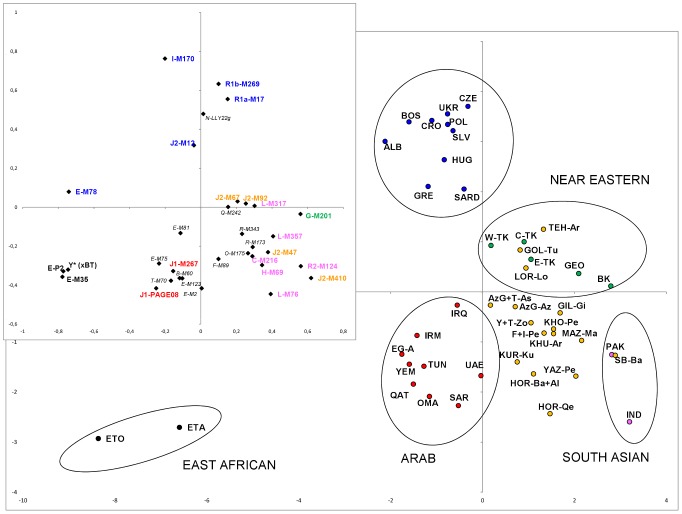
Figure 3. Principal component analysis performed using haplogroup frequencies in the Iranian populations of the present study (yellow) compared with those of relevant populations from the literature (East Africans in black, North African and Near Eastern Arabs in red, Europeans in blue, Turks and Caucasians in green and South Asians in pink).
For population codes, see Table S1. On the whole, 25% of the total variance is represented: 14% by the first PC and 11% by the second PC. Insert illustrates the contribution of each haplogroup. Characterizing haplogroups are reported with the same population colours.

