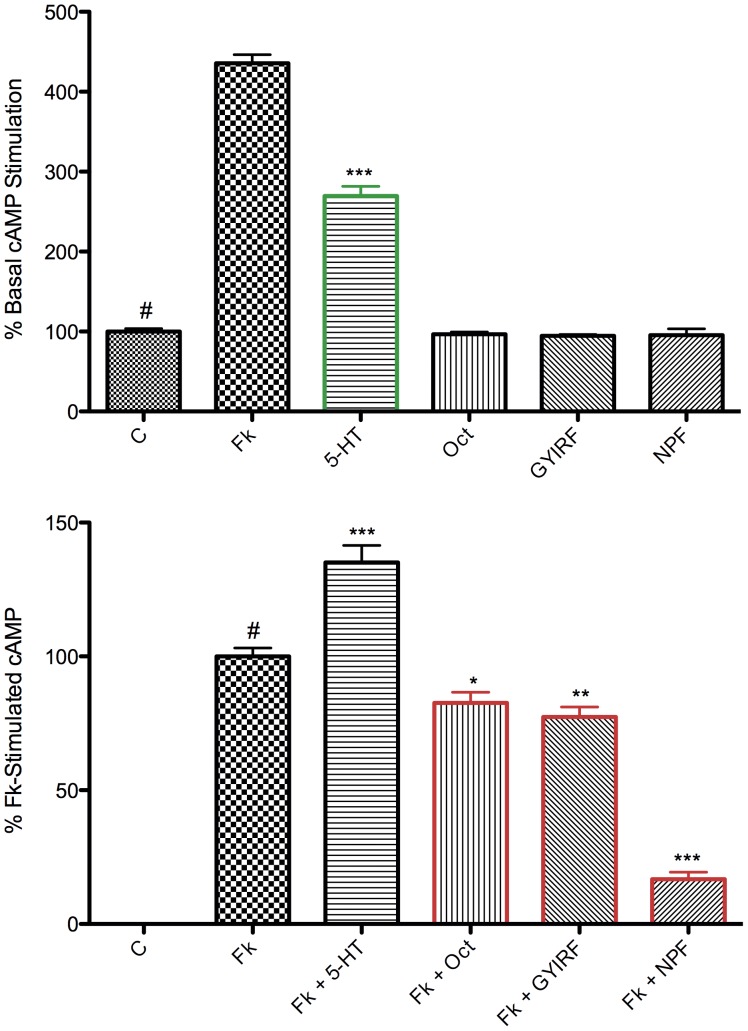
Figure 2. Peptide and biogenic amine ligand cAMP screen performed against isolated D. tigrina membranes.
RIA cAMP outputs are normalized and shown as mean  SEM, with asterisks representing statistically significant differences compared to a control bar (
 ); *P
); *P 0.05, **P
 0.01, ***P
 0.001, one-way ANOVA, Tukey post hoc test. Top: red-outlined bars signify ligands that stimulate cAMP compared to basal levels, likely mediated by G
 -coupled GPCRs. Bottom: red-outlined bars signify ligand inhibition of Fk-stimulated cAMP, likely mediated by G
 -coupled GPCRs. Serotonin (5-HT) stimulates basal cAMP, while octopamine (Oct), GYRIFamide (GYIRF), and neuropeptide F (NPF) all inhibit Fk-stimulated cAMP at 100 uM. These changes in cAMP are presumably receptor-mediated, and should therefore be altered in a ligand-specific manner by subtraction of particular receptor targets from cell membranes via RNAi.

