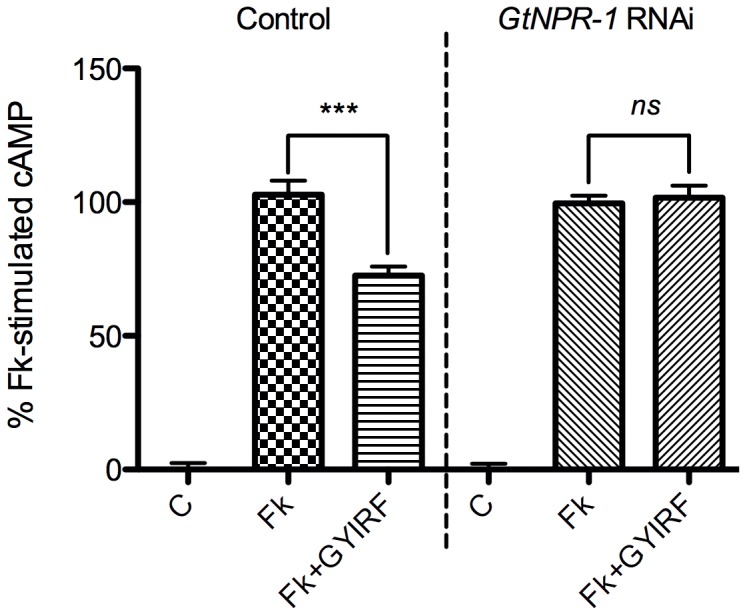
Figure 4. RNAi-based GtNPR-1 deorphanization.

Treatment groups are Control (control dsRNA) and GtNPR-1 RNAi (GtNPR-1 dsRNA). Treatments are C (control), Fk (10 M forskolin), and Fk
  GYIRF (10
 M forskolin and 10
 M GYIRFamide). Each bar is the mean (
 SEM) of 3 individual experiments. Basal cAMP levels were set as a baseline for each individual experiment, and cAMP values were normalized with respect to the level of Fk-stimulated cAMP (set at 100%). This allowed us to join datasets with differing basal cAMP levels, due to variance in the quality and yield of individual membrane preparations. Analysis of the raw cAMP values of individual experiments renders the same results (Table 1). Asterisks indicate significance at P
 0.001 (***), and “ns” indicates no significant difference (one-way ANOVA, Tukey post hoc test).
