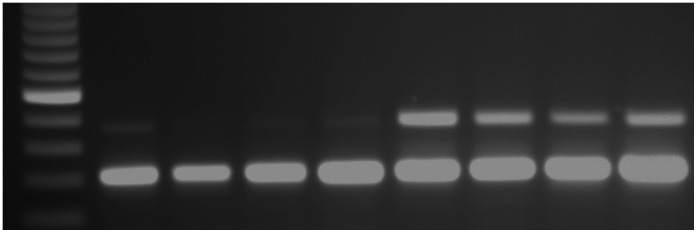
Figure 7. Semi-quantitative PCR reveals DtSER-1 knockdown.
Lane 1 is a 100 bp DNA ladder, lanes 2–5 represent individual DtSER-1 dsRNA-fed planarians, and lanes 6–9 represent control dsRNA-fed planarians. The bottom band (∼300 bp) is the 18S internal standard, and the top band (∼480 bp) shows DtSER-1 expression. The top band disappears in the experimental group, confirming near abolishment of DtSER-1 receptor expression in these worms.

