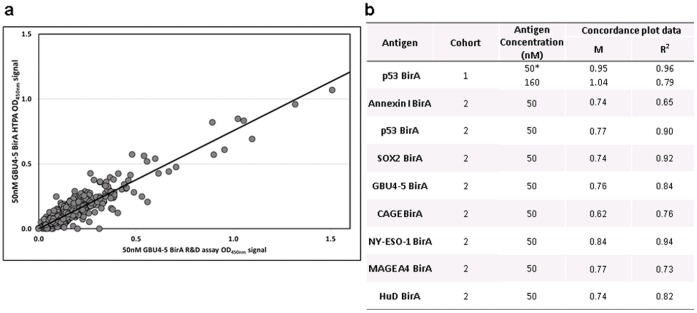
Figure 5. Assay format concordance.
Commercial batches of several antigens were used for HTPA and R&D assay formats where AAbs in cohorts 1 or 2 serum samples were detected by both assay formats: a) an example of a concordance plot between HTPA and R&D assay OD data for 50 nM GBU4-5 BirA; b) the gradient (m) and fit (R2) values for the plot shown and the remaining data sets. *HTPA data was an average from 3 assay data sets, performed on different days.

