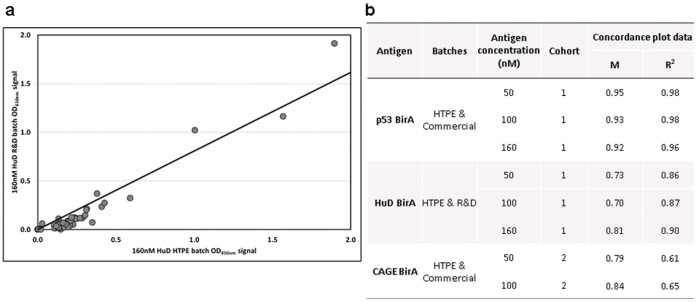
Figure 7. Batch concordance.
HTPE, R&D and commercial batches of several antigens at 50, 100 and 160 nM were used to coat plates, and AAbs in cohort 1 (p53 BirA and HuD BirA) and 2 (CAGE BirA) serum samples were detected by HTPA: a) an example of a concordance plot between the HTPE and Commercial batch OD data for 160 nM HuD BirA; b) the gradient (m) and fit (R2) values for the plot shown and the remaining data sets. a) Concordance plot between the OD signal for all antigens at both concentrations; b) the gradient (m) and fit (R2) values for the plot shown with and without Mesothelin. The concordance for this antigen was poor, demonstrated by the fact that when the values are taken out a much greater concordance is observed for the remaining 5 antigens.

