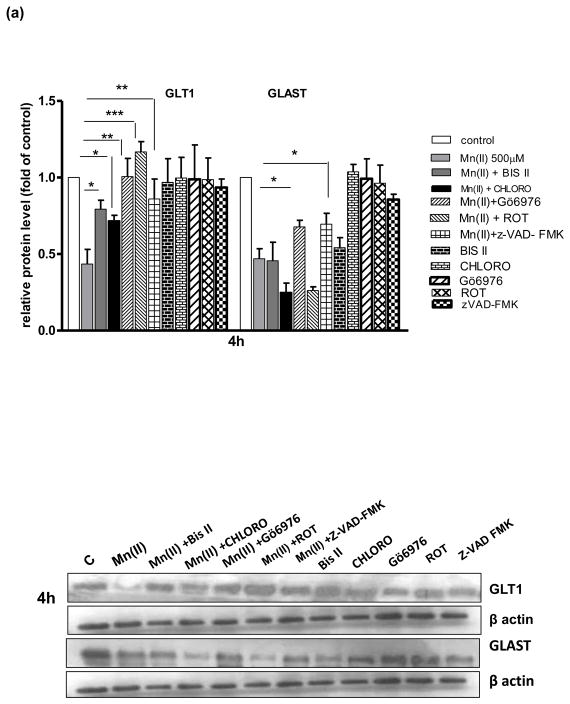
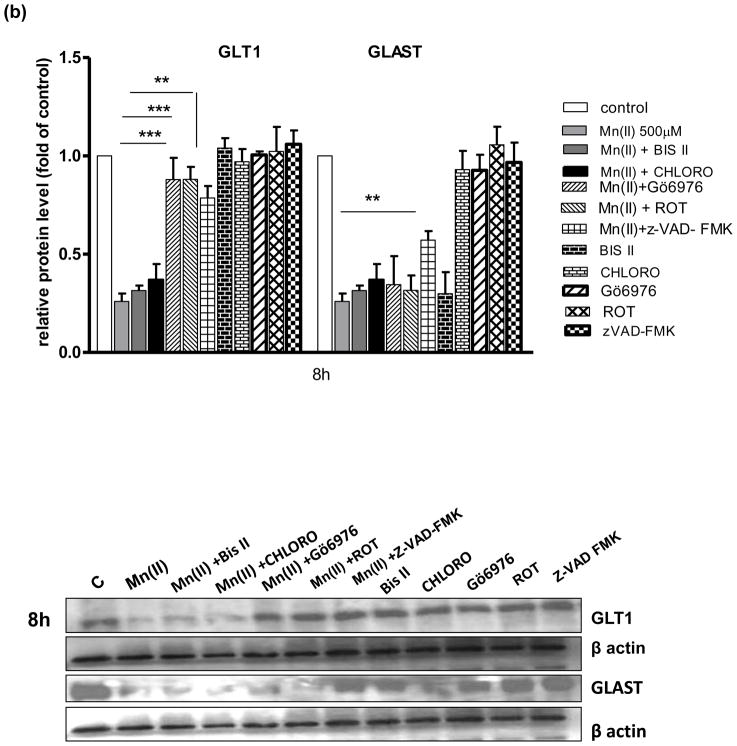
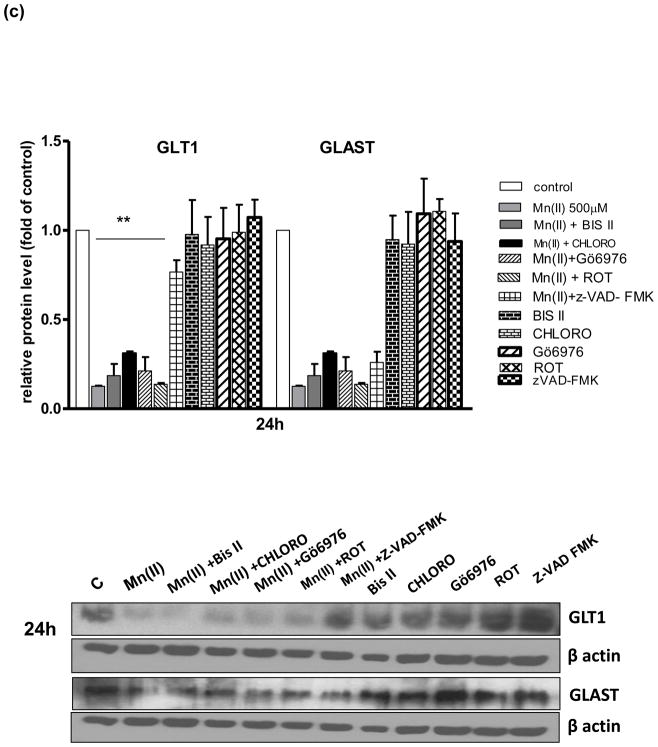
Fig. 4. Glutamate transporter protein levels after Mn exposure and/or inhibition of PKC signalling, caspase 3 and lysosomal pathways.
GLT1 and GLAST protein levels were determined by western blotting after 4, 8 or 24 h exposure to 500 μM Mn(II) alone or in presence of the general PKC inhibitor bisindolylmaleimide II BIS, the selective PKCα inhibitor Gö6976, the selective PKCδ inhibitor Rottlerin (ROT), the caspase inhibitor Z-VAD-FMK (Z-Ala-Glu(OMe)-Val-Asp(OMe)-fluoromethyl ketone), and the lysosomal inhibitor chloroquine (CHLORO). Data represent the mean ± S.D. from 4 independent sets of cultures, each performed in triplicate; two -way ANOVA found main effect of Mn(II) exposure ((F(1,42)=45.62, p<0.0001), Mn(II) x time interaction ((F(1, 42)=22.4 p<0.005), Mn(II) x Gö6976 interaction ((F(1, 42)=10.9 p<0.0052), and Mn(II) x zVAD-FMK interaction ((F(1,39)=12.89, p<0.0034) on GLAST protein level; two- way ANOVA found main effect of Mn(II) exposure ((F(1,38)=10.19, p<0.005; Mn(II) x time interaction ((F(1, 38)=31.3 p<0.005), Mn(II) x BIS II interaction ((F(1, 38)=7.848, p<0.031); Mn(II) x CHLORO interaction ((F(1, 38)=5.49, p<0.042), Mn(II) x Gö6976 interaction ((F(1, 40)=4.42, p<0.049), Mn(II) x ROT interaction ((F(1, 42)=3.19, p<0.0228); Mn(II) x zVAD-FMK interaction ((F(1, 42)=4.22, p<0.0252) on GLT1 protein level; *p < 0.05, **p < 0.01 vs. control (one-way ANOVA followed by post hoc Tukey’s test).


