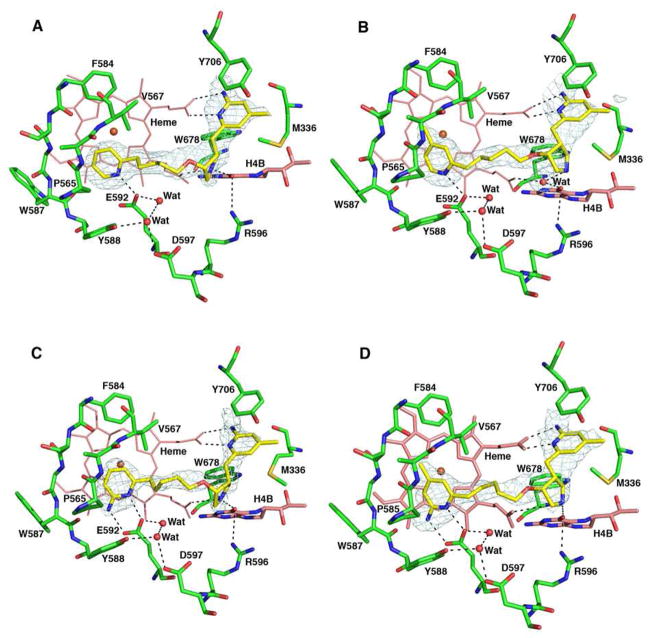
Figure 12.
Crystallographic binding conformation of 8 (A), 9 (B), 10 (C), and 11 (D) with rat nNOS. The omit Fo – Fc electron density maps for inhibitors are shown at 2.5 σ contour level. Major hydrogen bonds are depicted with dashed lines. The same atom color schemes shown in Figure 4 are used.

