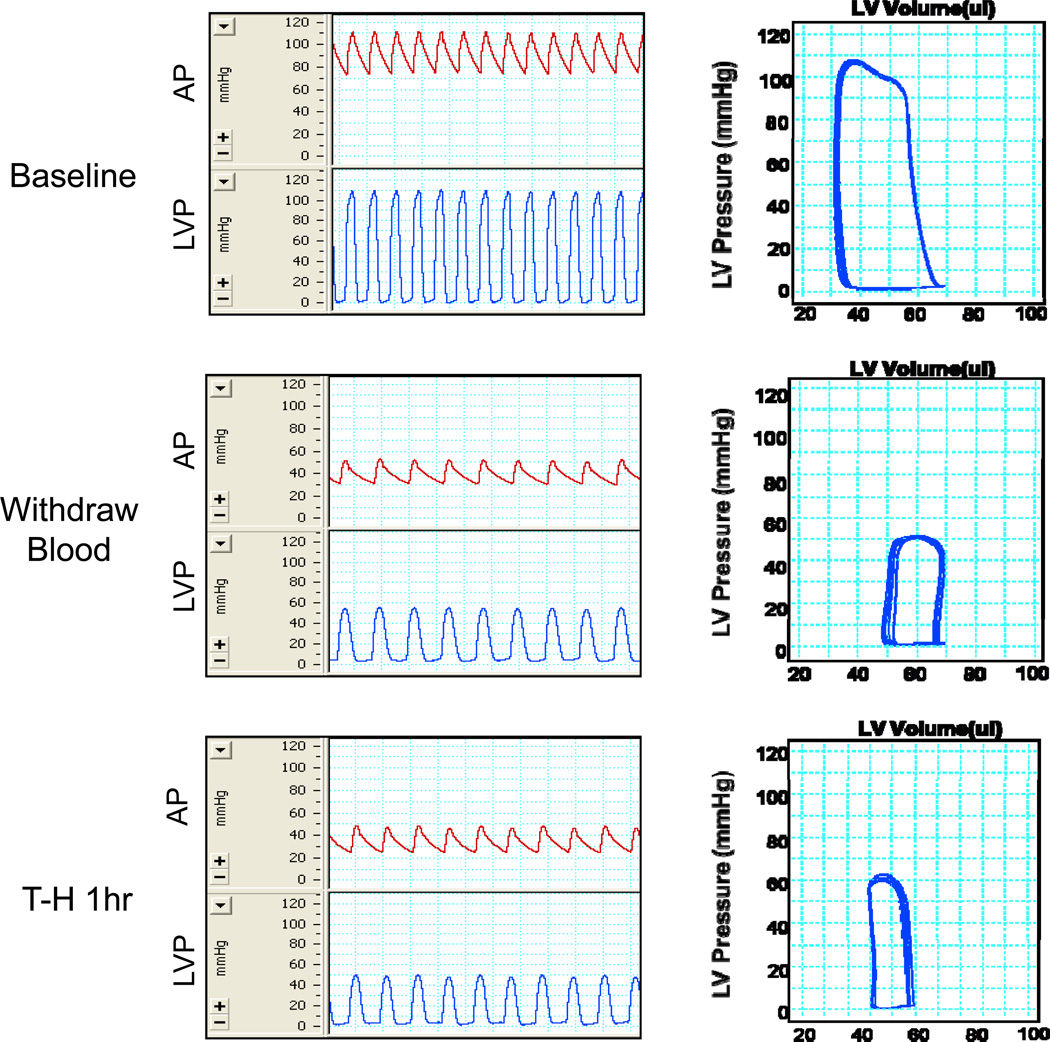
Figure 1. Cardiac performance before, during and after trauma-hemorrhage.
Blood was withdrawn from jugular vein till mean arterial pressure reached 35±5 mmHg. Arterial pressure (AP, mmHg), left ventricle pressure (LVP, mmHg) and left ventricular pressure-volume loops were measured at the time points “Before” (before hemorrhage), “During” (during the first 10 minutes of hemorrhage, the mean AP was maintained at 35±5 mmHg) and “After” (at 60 minutes after the initiation of hemorrhage) in the trauma-hemorrhage model. Representative graphs of untreated mice are shown above.

