
Figure 1. H&E histology of humerus from βcat GOF, LOF, and WT embryos.
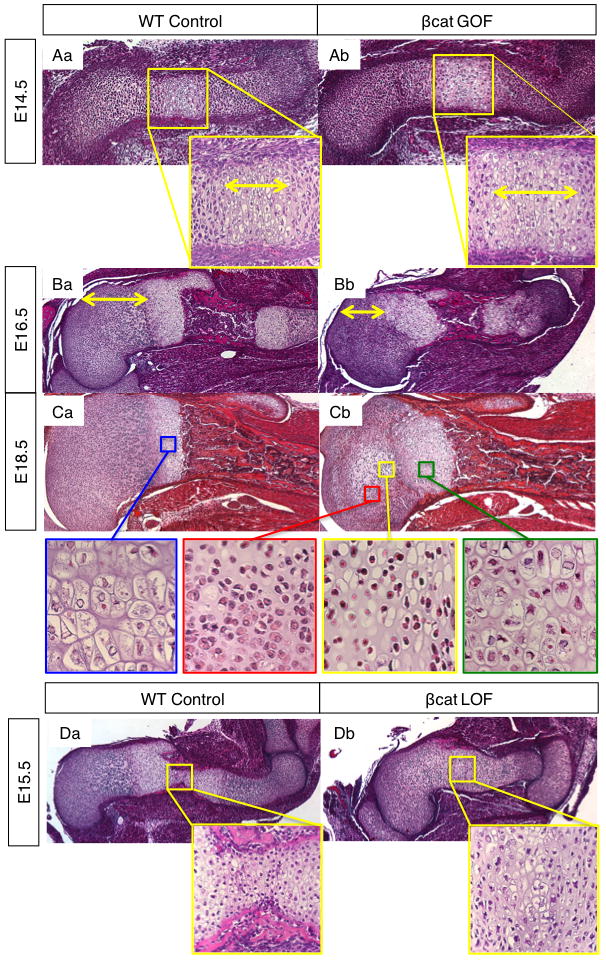
(A) Humerus sections from E14.5 WT (Aa) and β-cat GOF (Ab) littermate embryos (10X) with hypertrophic zone highlighted by double-headed arrows at high power (40X). (B) WT (Ba) and β-cat GOF (Bb) humerus at E16.5 with epiphysis to growth plate highlighted by yellow arrows (5X). (C) WT (Ca) and β-cat GOF (Cb) humerus at E18.5 (5X) with high power (40X) images of WT growth plate hypertrophic chondrocytes (blue box), and of GOF resting (red box), SOC (yellow box), and growth plate chondrocytes (green box). (D) Humerus from WT (Da) and βcat LOF (Db) littermates at E15.5 (5X) with high power (40x) magnification of mid-diaphysis.