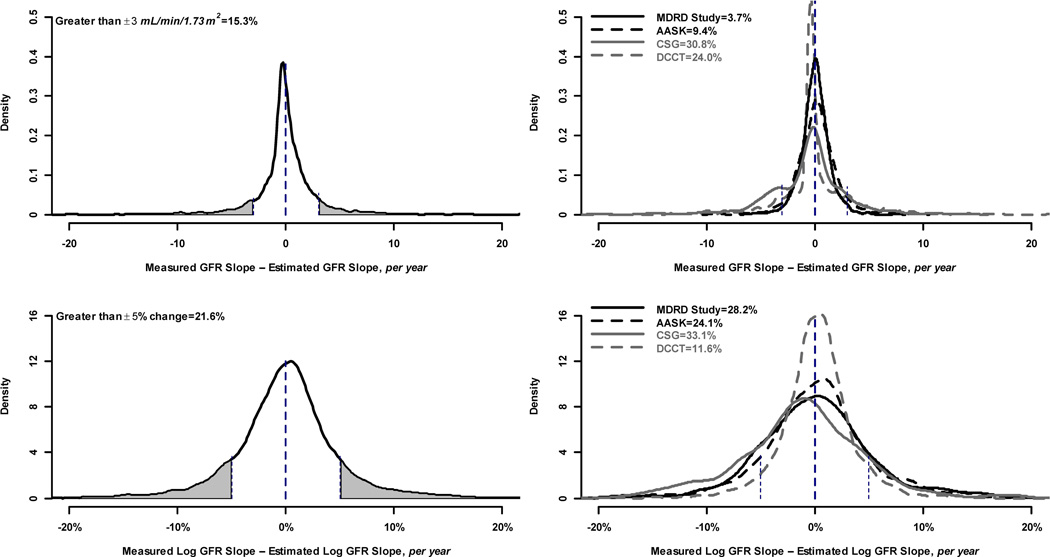
Figure 2.
Proportion of study subjects with large differences between slopes in measured and estimated GFR. Top row shows proportion with large differences defined by ± 3 ml/min per 1.73 m2. Bottom row shows proportion with large differences defined by 5% (±0.05 change on the log scale). Left hand column shows proportion with large differences in the pooled studies. Right hand column shows proportion with differences within each study. Vertical lines indicate the definition of large difference within each panel, and the shaded portion of the curve indicates the proportion of study subjects with a large difference.

