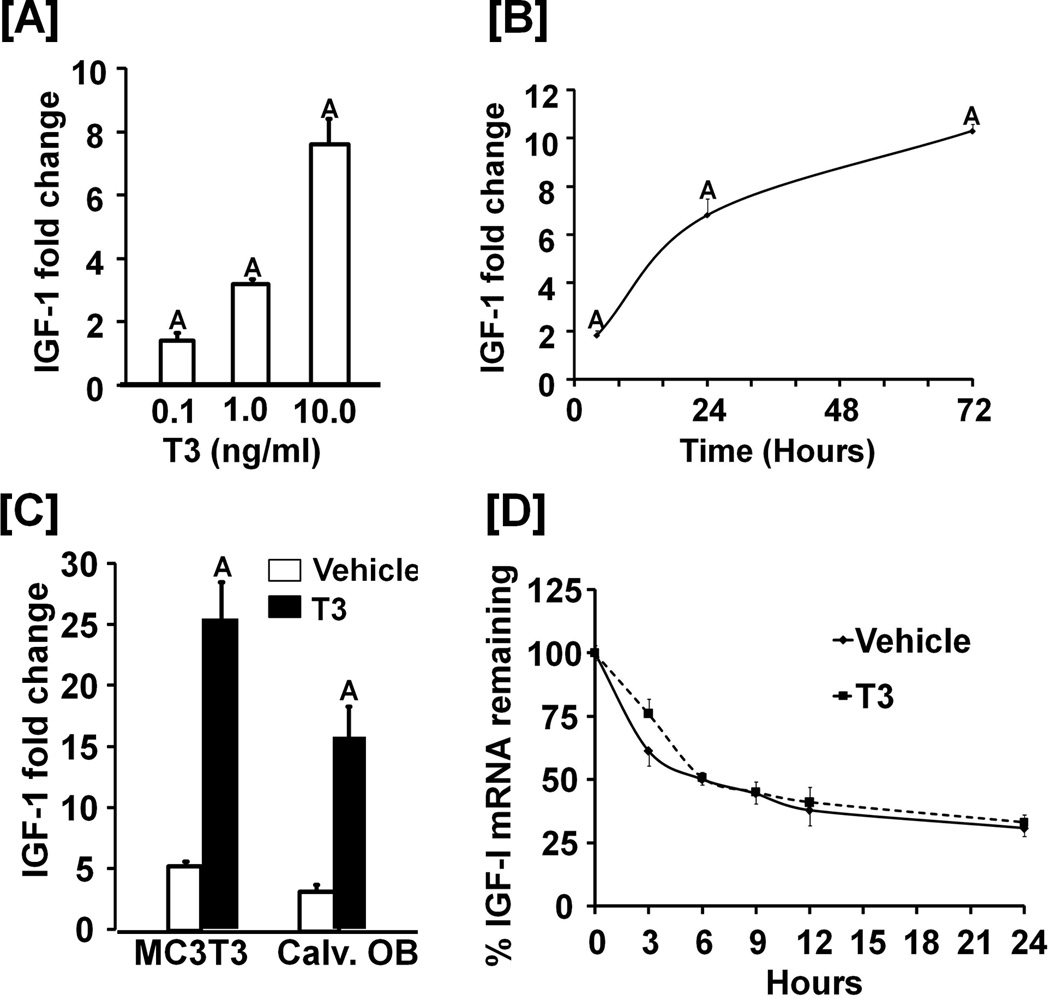
Figure 3. T3 stimulates IGF-1 expression in osteoblasts.
[A-B]: Dose (A) and time (B) –dependent effects of T3 on IGF-I expression in MC3T3-E1 cells. For the dose response experiment, cells were treated with 0.1–10 ng/ml of T3 for 24 hours. For time course studies, cells were treated with 10 ng/ml of T3 for 24 hours. Values are fold-change over the expression level of vehicle treated cells and expressed as the mean ± SEM (n = 3). A = P < 0.01 vs. vehicle control. [C]: T3 stimulates IGF-I protein expression. MC3T3-E1 cells or primary osteoblasts (Calv. OB) were treated with 10 ng/ml of T3 for 72 hours. Conditioned medium was collected for measurement of secreted IGF-I by RIA. Values are the mean ± SEM (n = 3). A = P < 0.01 vs. vehicle control. [D] Effect of T3 treatment on IGF-I mRNA stability. MC3T3-E1 cells were treated with 10 ng/ml T3 or vehicle for 24 hrs prior to the addition of actinomycin (10 µg/ml). Cells were harvested for RNA extraction and real time RT-PCR at the time points indicated. Data are expressed as mean ± SEM from 3 replicates.

