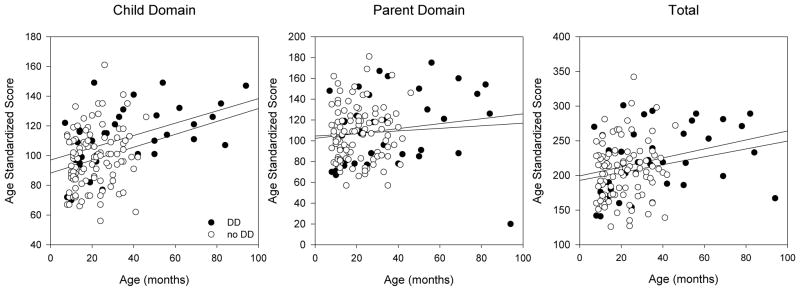
Figure 4. Baseline PSI domain scores.
These scores are not corrected for age and lower values indicate less stress. Children with DD did not have any domains with statistically-significant differences compared to children without DD. The slope of each line (change in score/change in months) and the p-value comparing patients with DD to those without DD after performing multiple linear regression analyses is given for each domain. Child Domain (DD: 0.289, no DD: 0.434, p=0.180); Parent Domain (DD: 0.0079, no DD: 0.123, p=0.373); Total (DD: 0.298, no DD: 0.749, p=0.994).

