Figure 1.
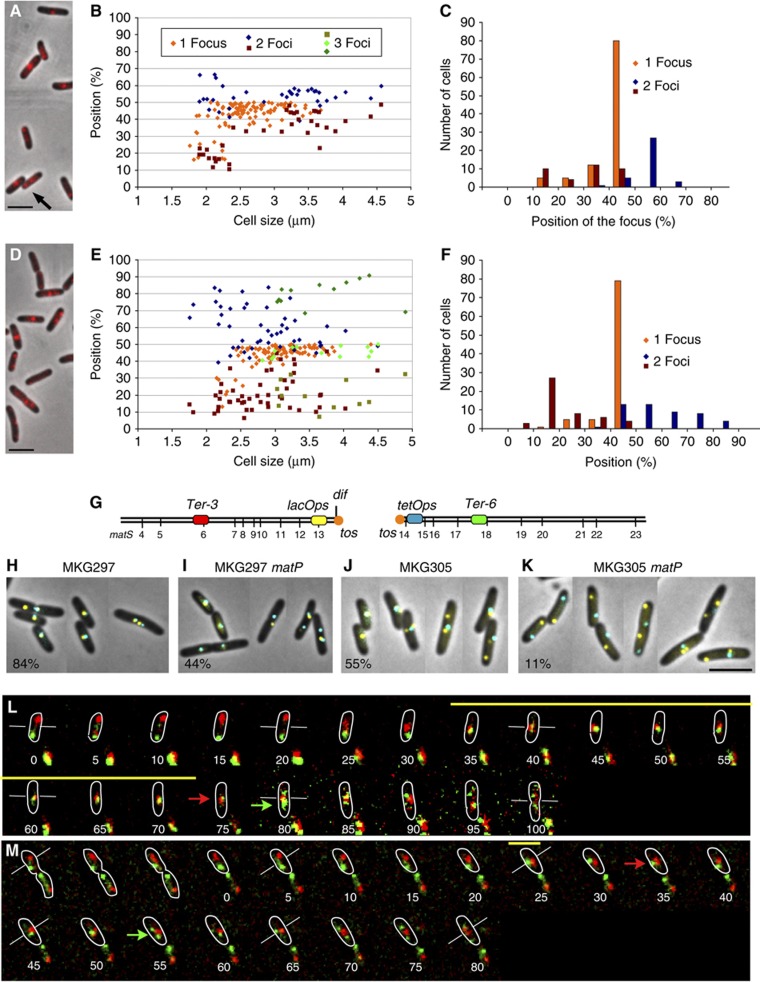
MatP holds the Ter MD at mid-cell. (A) Merged picture of MatP–mCherry (red) and phase-contrast micrographs (grey) of MG1655 cells with a circular chromosome. (B) Histogram of the relative positions from the pole of the cell of MatP–mCherry foci observed in (A) according to cell size. Cells with one focus or two foci are indicated. (C) Histogram representing the number of cells with 1, 2 or 3 MatP–mCherry foci observed in (A) according to the position of the focus. (D) Merge of MatP–mCherry (red) and phase-contrast micrographs (grey) in MG59 cells with a linearized chromosome. Cells with one focus or two foci are indicated. (E) Histogram of the relative positions from the pole of the cell of the MatP–mCherry foci according to cell size. (F) Histogram representing the number of cells with 1, 2 or 3 MatP–mCherry foci according to the position of the focus. (G) Map of the Ter MD with the position of the matS sites and the FROS tags used in the following panels. (H–K) localization of the lacOps and tetOps FROS tags in strains with circular or linear chromosome. (H) wt MKG297 strain. (I) MKG297matP. (J) MKG305 linear chromosome. (K) MKG305matP. The percentage of cells presenting at least one lacOps and one tetOps colocalized at mid-cell is indicated. (L) Merged pictures of a time-lapse experiment with 5 min intervals for the segregation of the Ter-3 (red) and Ter-6 (green) loci in strain MG59 (linear chromosome). Because photobleaching grey levels in the montage were not homogeneously set, starting at the time point 75 min a narrow grey scale was used for both fluorescence channels. The yellow bar represents the extent of colocalization of the red and green foci, the white bars tag the mid-cell for specific stages, the red and green arrows represent, respectively, the duplication of the Ter-3 and Ter-6 focus. Outlines of the cells were drawn according to phase-contrast images. The red and green foci at the bottom of each image correspond to foci from adjacent cells. (M) Merged pictures of a time-lapse experiment with 5 min intervals for the segregation of the Ter-3 (red) and Ter-6 (green) loci in strain MG59matP (linear chromosome). Same representation as in (L). Scale bars represent 3 μm.

