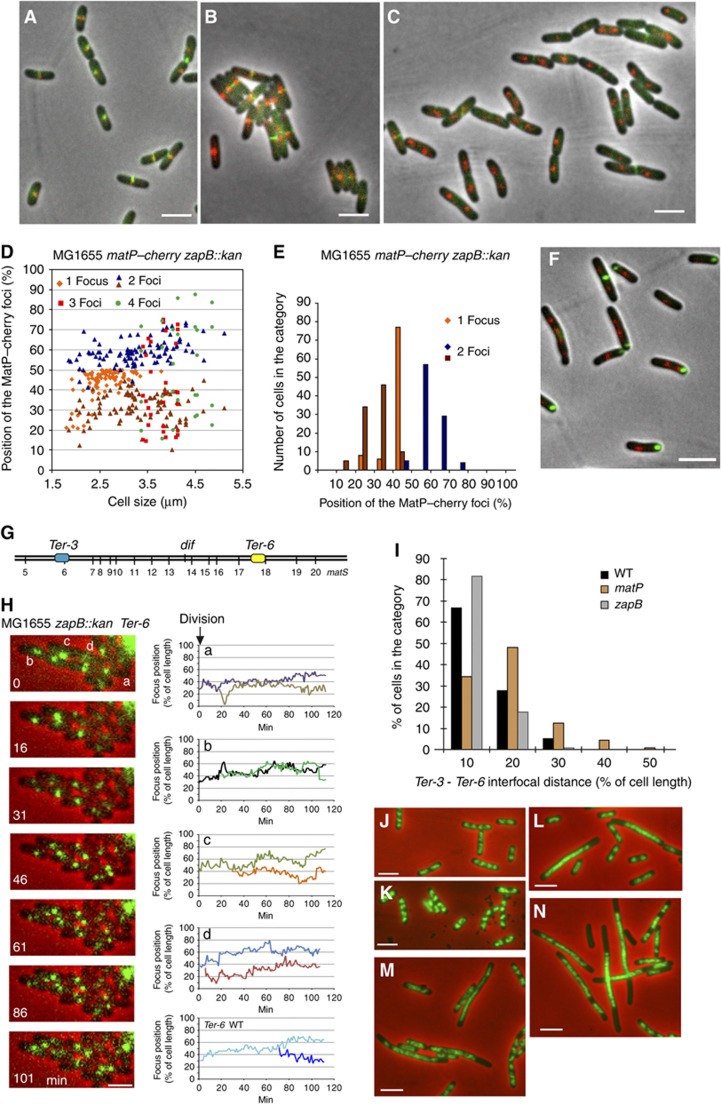
Figure 6.
Influence of ZapB-mediated anchoring on the Ter MD and chromosome dynamics. (A) MatP–mCherry (red) and ZapB–GFP (green) are colocalized in wild-type cells. (B) MatP–mCherry (red) and ZapA–GFP (green) are colocalized in wild-type cells. (C) MatP–mCherry (red) and ZapA–GFP (green) are not colocalized in the MG1655zapB mutants. (D) Histogram of the relative position of MatP–mCherry foci according to MG1655zapB cell size. Cells with 1, 2, 3 or 4 foci are indicated. (E) Histogram of the number of cells in each category of MatP–mCherry position (180 cells were counted). (F) MatP–mCherry (red) and ZapB–GFP (green) are not colocalized in the MG1655zapA strain. (G) Map of the tags inserted in the chromosome of the MG1655 zapB strain that were used in (H–J), parSP1 (Ter-3) and parSpMT1 (Ter-6) positions are represented. (H) Segregation of Ter-6 (parSpMT1) tag. MG1655zapB cells were followed during a 120-min time lapse at 1-min intervals. One picture every 16 min was represented on the montage. Traces representing the segregation of the Ter-6 tag in the MG1655zapB cells annotated in the montage (a–d) and in wt MG1655 cells. (I) Measure of the interfocal distance between Ter-3 (parSP1) and Ter-6 (parSpMT1) loci in the MG1655, MG1655matP and MG1655zapB strains. (J) DAPI staining (green) of the nucleoid of the MG1655zapA strain grown in rich medium (LB). (K) DAPI staining of the nucleoid of the MG1655zapB strain. (L) DAPI staining of the nucleoid of the MG1655matP strain. (M) DAPI staining (green) of the nucleoid of the MG1655zapAmatP strain. (N) DAPI staining of the nucleoid of the MG1655zapBmatP strain. Cells presented on the panels (J–N) were grown in rich LB medium to O.D.=0.3. Scale bars represent 3 μm.

