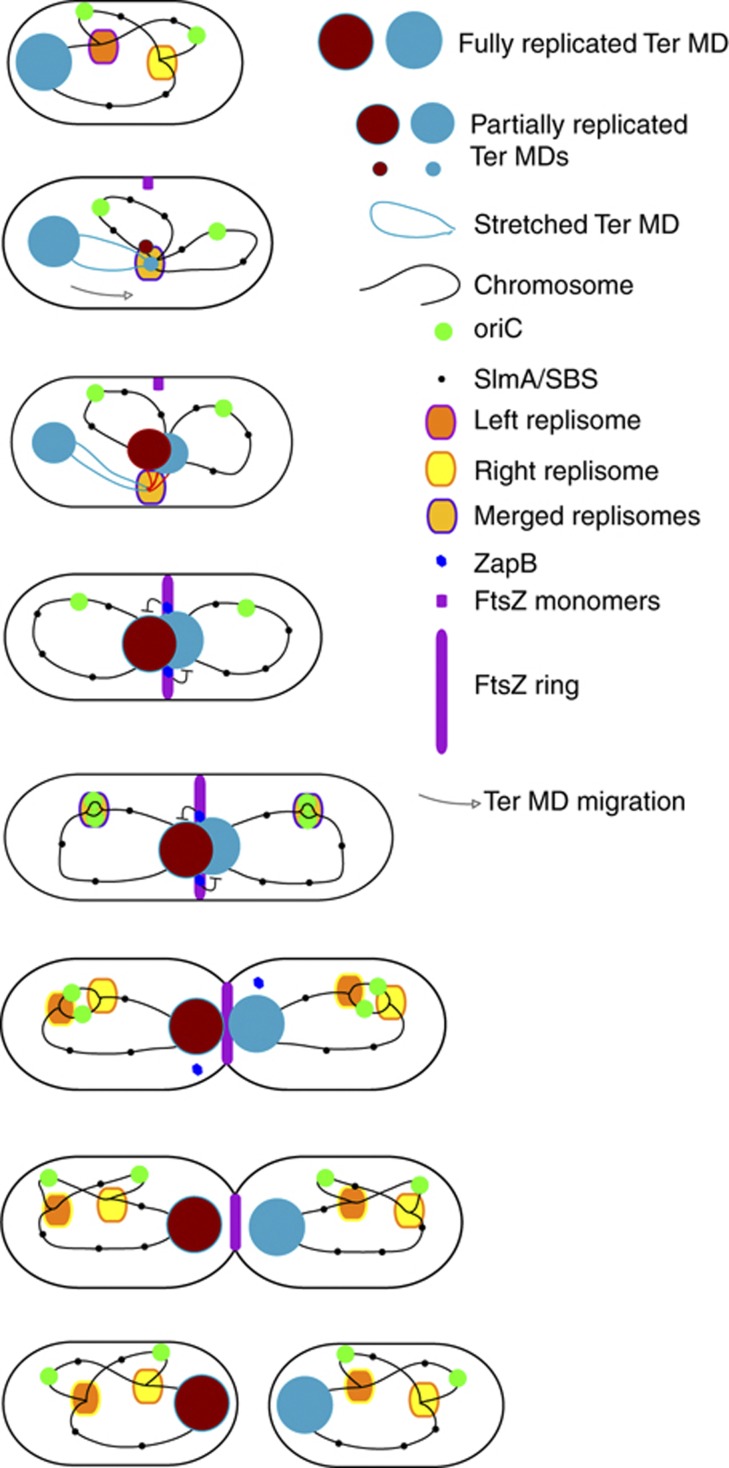
Figure 7.
Model for the Ter MD dynamics during the cell cycle. Schematic diagram of a complete cell cycle, from birth to the next division. Steps of ∼10 min are described. The dynamics of the Ter MD (red–brown ball) is proposed according to the observations described above. The migration of the Ter DNA is illustrated with an arrow. ZapB-mediated anchoring of the sister Ter MDs to the septal ring is illustrated.

