Figure 4.
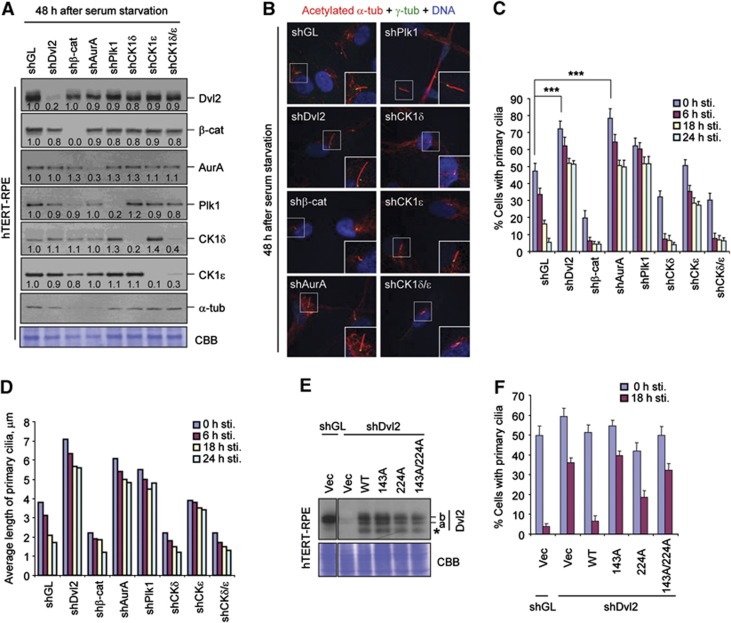
Induction of primary cilia disassembly by the CK1ε-dependent Plk1–Dvl2 p-S143/p-T224 complex. (A–D) hTERT-RPE cells infected with the indicated sh-lentiviruses were first starved for 48 h. A set of the resulting cells was harvested for immunoblotting (A) or immunostaining (B) analyses. Enlarged images of cilia are shown in the boxes at the bottom right corner (B). Another set of the starved cells was subsequently stimulated with serum, fixed at the indicated time point, and immunostained. The cells with primary cilia were then counted (C) and the average lengths of primary cilia among cilia-positive cells were quantified (D). Numbers in (A) indicate signal intensities relative to α-tubulin signals. Both anti-α-tubulin immunoblotting and Coomassie (CBB) staining were carried out for loading controls. Error bars, standard deviation from more than three independent experiments. Statistics: ***P<0.001 (unpaired two-tailed t-test). (E, F) hTERT-RPE cells expressing the indicated constructs were infected with lentivirus expressing either control shGL or shDvl2, and then immunoblotted (E). The resulting cells were starved for 48 h and then stimulated with serum. The cells harvested at the indicated time points after serum stimulation were immunostained and quantified (F). Note that cells infected with lentiviruses (expression or RNAi viruses) exhibited less efficient primary cilia formation. Asterisk, degradation product. Error bars, standard deviation from more than three independent experiments. For samples in (C, D, F), >300 cells were counted for each sample. Figure source data can be found with the Supplementary data.

