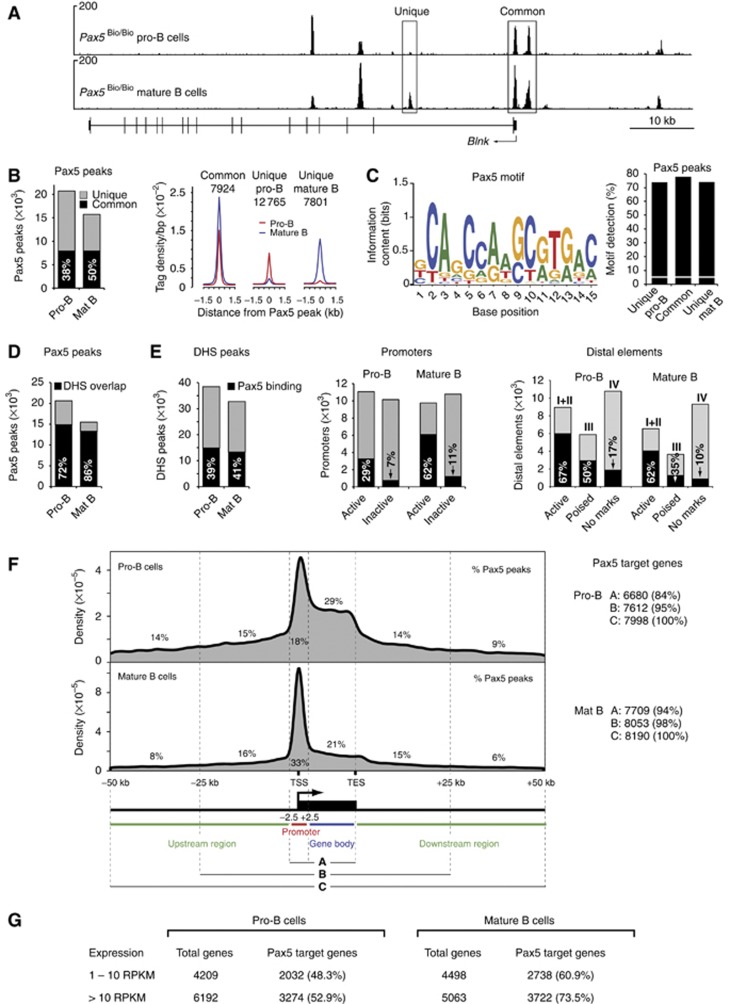
Figure 3.
Pax5-binding pattern and identification of Pax5 target genes in pro-B and mature B cells. (A) Pax5 binding at the Blnk locus as defined by Bio-ChIP sequencing of Pax5Bio/Bio Rag2−/− pro-B cells and mature Pax5Bio/Bio B cells. Unique and common Pax5-binding sites are indicated together with the exon–intron structure of Blnk and a scale bar (in kb). (B) Overlap of Pax5 peaks in pro-B and mature B cells. Total numbers of 20 613 and 15 468 Pax5 peaks with an overlap of 7924 common peaks (black bar) were identified in pro-B and mature B cells, respectively, by peak calling relying on a P-value of <10−10 (Supplementary Figure S4A). Average sequence tag density profiles aligned at the centre of the Pax5 peaks are shown for common and unique Pax5-binding sites (right). The genomic coordinates of the Pax5 peaks are provided in Supplementary Table S6. (C) Consensus Pax5 recognition sequence identified by de-novo motif discovery, as described in Supplementary Materials and Methods. The Pax5-binding motif is shown with its information content indicating the size and complexity of the predicted binding. This motif was detected at the indicated frequency (%) in common and unique Pax5 peaks (right), whereas it was found only in 5.6% of random DNA sequences (white line). (D) Overlap of Pax5 peaks with DHS sites (black bar) in pro-B and mature B cells. (E) Pax5 binding at DHS sites, promoters and distal elements in pro-B and mature B cells. The percentage of Pax5 binding (black bar) to the different elements is indicated. (F) Density profiles indicating the distribution of Pax5 peaks relative to RefSeq-annotated genes in pro-B and mature B cells. DNA sequences from −2.5 kb to +2.5 kb relative to the TSS are referred to as promoter region. TES, transcription end site. The numbers of Pax5 target genes (right) were defined by the three criteria shown. (G) Expression of Pax5 target genes as determined by RNA sequencing of ex vivo sorted Rag2−/− pro-B cells and mature B cells. Similar results (A–F) were obtained by analysing a second Bio-ChIP-seq experiment for each cell type (Supplementary Table S1).

