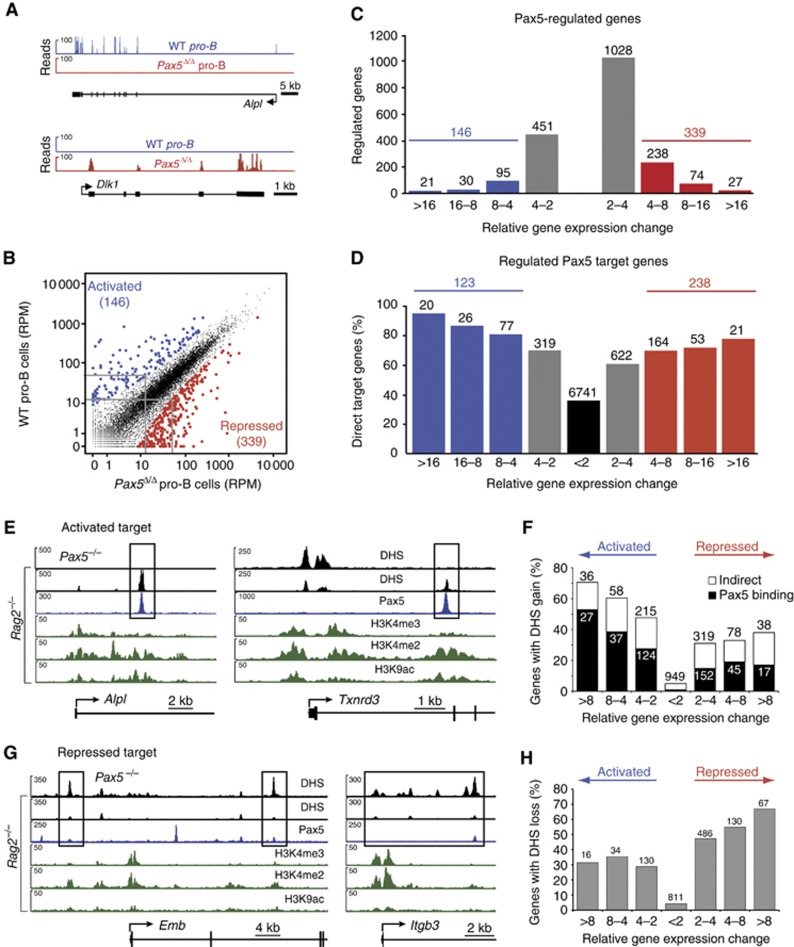
Figure 4.
Regulation of Pax5 target genes by gain and loss of enhancers in pro-B cells. (A) Expression of the Pax5-activated Alpl and Pax5-repressed Dlk1 genes in pro-B cells, as determined by RNA sequencing of short-term cultured Pax5fl/fl (WT) and Vav-Cre Pax5fl/fl (Pax5Δ/Δ) pro-B cells (Supplementary Figure S5A). (B) Scatter plot of gene expression differences observed between WT and Pax5Δ/Δ pro-B cells. The normalized expression value of each gene in the two pro-B-cell types was plotted as reads per gene per million mapped sequence reads (RPM) as described in Supplementary Materials and Methods. Genes with an expression difference corresponding to a significance value of >20 or <−20 are highlighted in blue and red, respectively. The cutoff value of 20 corresponds to a four-fold expression change for a gene that is expressed at 15 RPM in the lower expressing cell type, as indicated by grey lines. (C) Pax5-regulated gene expression. The number of differentially expressed genes in wild-type pro-B cells compared with Pax5Δ/Δ pro-B cells is shown for the indicated fold expression changes corresponding to a gene that is expressed at 15 RPM in the lower expressing cell type (see Supplementary Materials and methods). (D) Identification of activated and repressed Pax5 target genes in pro-B cells. The number and percentage of Pax5 target genes are shown for the indicated gene expression differences between wild-type and Pax5Δ/Δ pro-B cells. The expression of the most highly activated (20) and repressed (21) Pax5 target genes is shown in Supplementary Figure S5B and C. Results similar to (A–D) were obtained by analysing a second RNA-seq experiment for each pro-B-cell type (Supplementary Table S1). The RNA-seq data of the regulated Pax5 target genes are shown in Supplementary Table S7. (E) Induction of enhancers at the activated Pax5 target genes Alpl and Txnrd3 in pro-B cells. DHS sites (black) are shown for Rag2−/− and Pax5−/− pro-B cells together with the active chromatin profile (green) in Rag2−/− pro-B cells and the Pax5-binding pattern (blue) analysed in Pax5Bio/Bio Rag2−/− pro-B cells. (F) Gain of DHS sites at Pax5-activated genes. The number and percentage of Pax5-activated and Pax5-repressed genes with gain of a DHS site at distal elements in Rag2−/− pro-B cells are shown for the indicated expression changes observed between Rag2−/− and Pax5−/− pro-B cells (see C). Black bars indicate the presence of Pax5 binding at the induced DHS site in Rag2−/− pro-B cells, whereas white bars denote the absence of Pax5 peaks. (G) Loss of DHS sites at the repressed Pax5 target genes Emb and Itgb3 in Rag2−/− pro-B cells. Supplementary Figure S6C documents the transient binding of Pax5 at the DHS sites of Emb and Itgb3 in 4-hydroxytamoxifen-treated Pax5−/− pro-B cells expressing a Pax5–oestrogen receptor fusion protein, which was determined by ChIP–qPCR analysis with primers shown in Supplementary Table S9. (H) Loss of DHS sites at Pax5-repressed genes in Rag2−/− pro-B cells. Pax5 binding was not evaluated, as Pax5 peaks in Rag2−/− pro-B cells were often small or absent at the position, where a DHS site was present in Pax5−/− pro-B cells.

