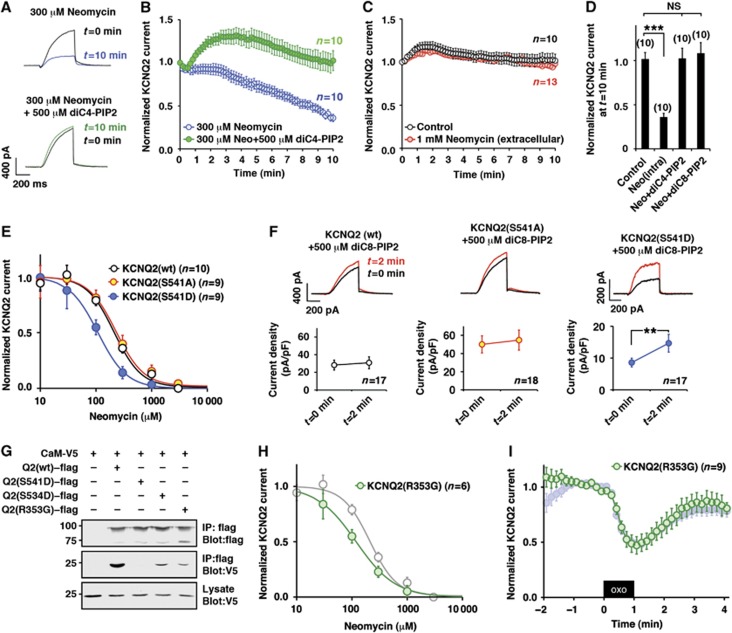
Figure 4.
KCNQ2–calmodulin interaction determines PIP2 affinity of KCNQ2 channel. (A, B) Neomycin-induced rundown of KCNQ2 current and its prevention by diC4-PIP2. Current traces (A) and pooled data (B) show neomycin-induced rundown of KCNQ2 current (blue circles). This rundown was prevented by further addition of diC4-PIP2 in the patch pipette solution (green circles). KCNQ2 currents were normalized to KCNQ2 current at t=0. (C) Extracellular application of 1 mM neomycin (orange circles) did not affect KCNQ2 current compared with the control (open circles). (D) Histogram depicting KCNQ2 currents at t=10 min showing that both diC4-PIP2 and diC8-PIP2 are equally effective to restore KCNQ2 current rundown induced by neomycin. Values for control, intracellular neomycin and diC4-PIP2 are from (B, C). NS: not significant, ***<0.001 by nonparametric ANOVA followed by t-test. (E) Dose-response curves for neomycin measured at 10 min after rupturing the plasma membrane. Indicated concentration of neomycin was included in the patch pipette. Wild-type KCNQ2 (open circles, KCNQ2 (S541A) (yellow circles), and KCNQ2 (S541D) (blue circles) are shown. Solid lines show the best fits using one component Hill equation. See Supplementary Figure 1 for parameters. (F) Augmentation of KCNQ2 currents by diC8-PIP2 in the patch pipette solution. KCNQ2 (wt) and KCNQ2 (S541A) did not show apparent augmentations (P>0.05, paired t-test), while KCNQ2 (S541D) showed 1.7-fold increase (** <0.01, paired t-test), suggesting that endogenous PIP2 is not at saturating concentration for KCNQ2 (S541D). (G) Calmodulin binding of other KCNQ2 mutants including KCNQ2 (R353G) and KCNQ2 (S534D) compared with that of KCNQ2 (wt). (H) Dose response curve for neomycin of KCNQ2 (R353G) overlaid to that of KCNQ2 (wt) shown in (E) (grey circles). (I) KCNQ2 (R353G) (green circles) showed hyperreactivity to 0.1 μM oxo-M. Oxo-M response of KCNQ2 (S541D) shown in Figure 1D is also shown as a reference (shaded blue circles). Error bars indicate s.e.m.

