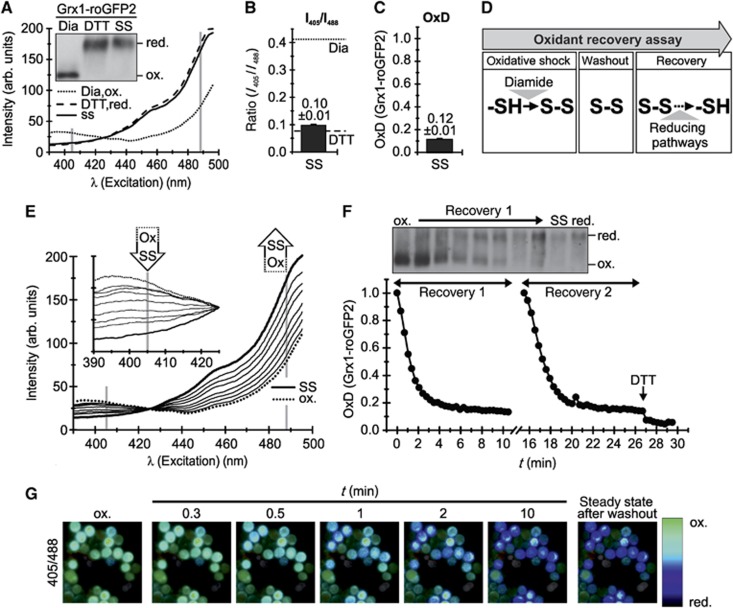
Figure 1.
Establishment of an assay to dynamically monitor the glutathione redox potential. (A) Properties of the Grx1-roGFP2 sensor. WT yeast cells expressing Grx1-roGFP2 were grown to mid-log phase in galactose-containing media. Excitation spectra (λemission=511 nm) were recorded on untreated cells (steady state=SS), and on cells pretreated with DTT or diamide (Dia). In parallel, the sensor redox states were analysed by alkylation shift assays (inset). (B) Ratiometric analysis of the steady state of the Grx1-roGFP2 sensor in the cytosol of S. cerevisiae. Excitation spectra were obtained as described in (A). The ratio of the intensities at 405 and 488 nm was formed for the steady state, the DTT and the diamide value. (C) Steady state of the Grx1-roGFP2 sensor in the cytosol of S. cerevisiae. The steady-state ratio from (B) was transformed to the degree of sensor oxidation—OxD (for calculation see Materials and methods) with an OxD=1 for the fully oxidized probe; OxD=0 for the fully reduced probe. (D) Scheme for the set-up of an oxidant recovery experiment. Yeast cells were incubated with 20 mM diamide for 5 min at 30°C under constant agitation, the oxidant was removed by washing twice with measurement buffer, and the recovery of the respective Grx1-roGFP2 sensors was monitored using a fluorescence spectrometer. Excitation spectra were obtained at different times after diamide washout using an emission wavelength of 511 nm. (E) Excitations spectra of an oxidant recovery experiment using Grx1-roGFP2. WT yeast cells expressing Grx1-roGFP2 were grown to mid-log phase in SC galactose media, and treated according to the protocol described in (D). (F) Recovery assay after oxidative shock. As (E) except that the intensities at the excitation wavelengths 405 and 488 nm were normalized to OxD values. The experiment could be repeated with the same sample (recovery 1, recovery 2). In parallel to recovery 1, the sensor redox states were analysed by alkylation shift assays (inset). (G) False colour fluorescence microscopy images of the recovery of the cytosolic redox sensor after oxidative shock in yeast cells.

