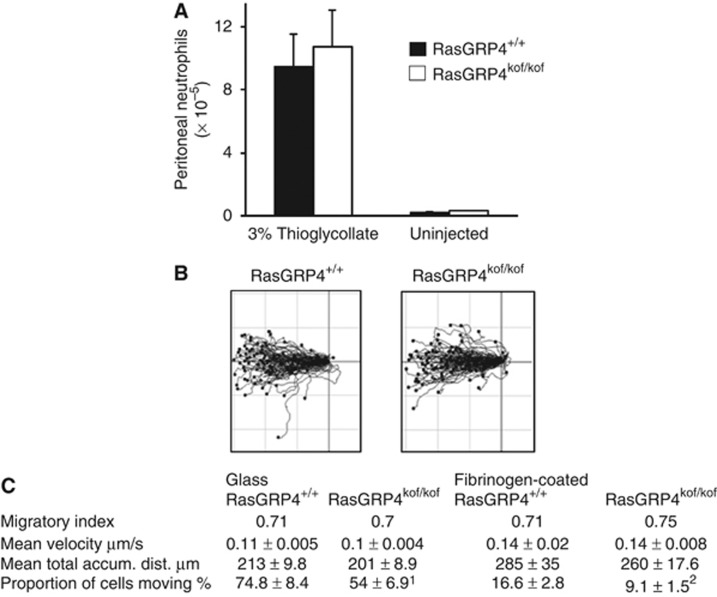
Figure 5.
Neutrophil migration in vitro and in vivo. (A) RasGRP4kof/kof and RasGRP4+/+ mice were injected intraperitoneally with thioglycollate. After 3.5 h, the neutrophils that had migrated into the peritoneum were quantified. The data are presented as means±s.e. from 4 independent experiments including a total of 14 RasGRP4+/+ and 15 RasGRP4kof/kof mice. (B) Neutrophils were isolated from RasGRP4kof/kof or RasGRP4+/+ mice and assayed for their ability to respond to, and migrate within, fMLP gradients on either untreated glass or fibrinogen-coated glass. Data are presented as centre-zeroed individual tracks (untreated glass only) for cells that moved a total accumulated distance of >25 μm. (C) Data were extracted from individual cell tracks like those in (B) using the ImageJ-plug-in Chemotaxis tool. The % of cells that moved (a total accumulated distance of >25 μM) are presented as means±s.e. A univariate analysis of variance showed 1P=0.014 and 2P=0.041.

