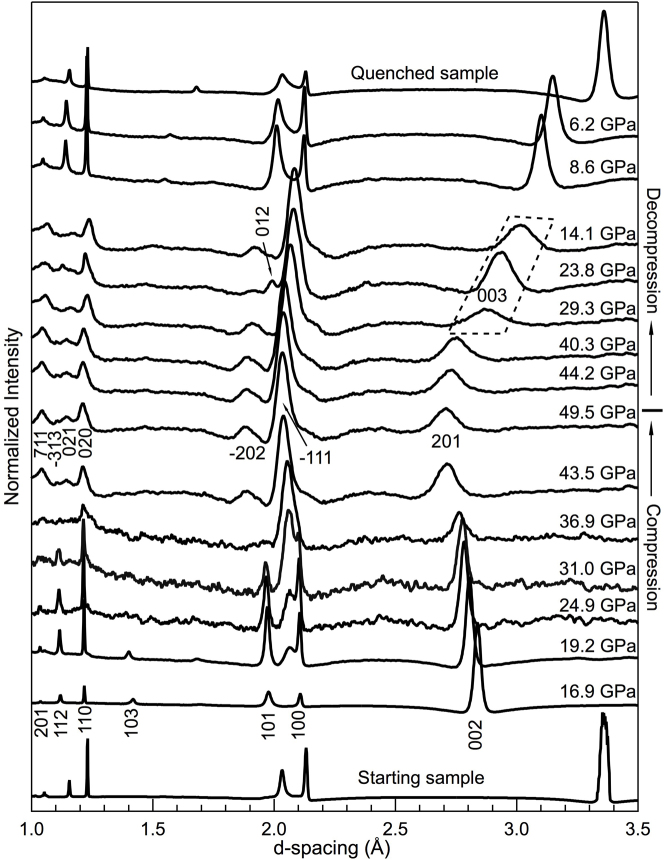
Figure 1. Synchrotron XRD patterns of H-graphite and its successive phases under cold compression.
The bottom portion of the figure shows XRD patterns obtained on compression, whereas the upper portion contains XRD patterns acquired on decompression. The hkl indices for H-graphite, M-carbon and R-graphite are marked on the patterns acquired at 16.9, 49.5, 29.3, and 23.8 GPa, respectively. Among them, peaks (003) and (012) belong to R-graphite. At 19.2 GPa, the first evidence of M-carbon, the (−111) peak (the most intense peak predicted), appears between the (100) and (101) peaks of H-graphite. On compression and below 36.9 GPa, all of the XRD patterns are collected after at least 6–9 hours relaxation. Above 36.9 GPa and on decompression, we collect XRD data immediately upon pressure change.

