
Figure 6. Photomicrographs (reflected light) and XRD patterns show the evolution of compressed sample as a function of relaxation time.
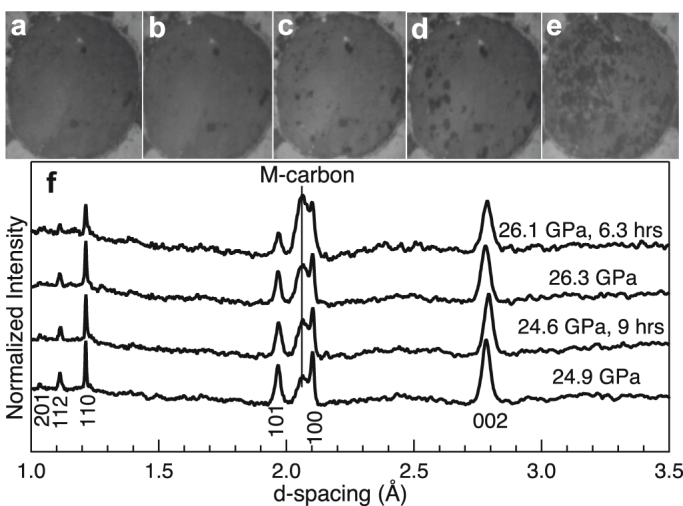
Images taken at pressures of (a) 6.9 and (b) 19.8 GPa, respectively, in which the dark spots come from ruby chips. Images obtained at a nominal pressure of 19.8 GPa after relaxation times of (c) 1, (d) 51, and (e) 93 hours, respectively. (f) XRD patterns immediately obtained at pressures of 24.9 and 26.3 GPa and after 9 and 6.3 hours of relaxation time, respectively.