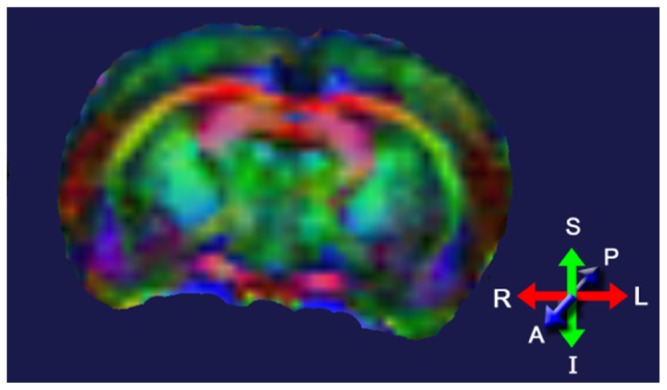
FIGURE 4.

Diffusion tensor image of a rat brain color-coded to show the predominant direction of diffusion in various brain regions; blue indicates diffusion between anterior (A) and posterior (P), red indicates flow between left (L) and right (R), and green indicates flow between superior (S) and inferior (I). Adapted from Robbins et al. (2012).
