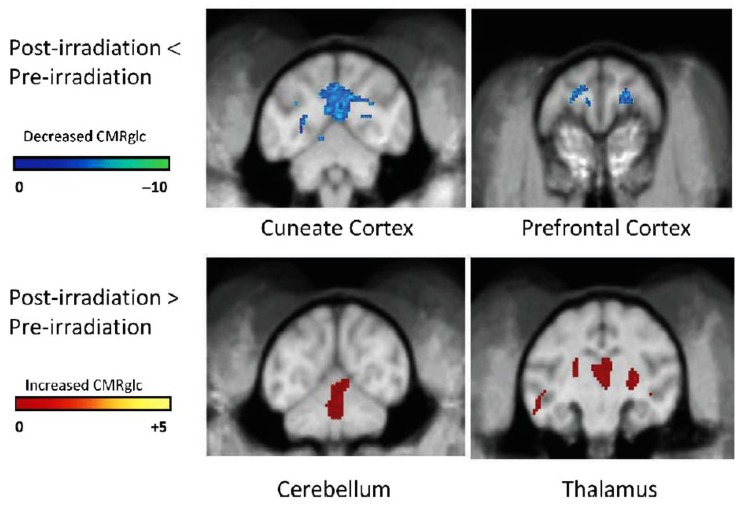
FIGURE 5.
[18F]FDG-PET scans of cerebral glucose metabolism 9 months after fWBI of young adult male non-human primates. Upper panel: post-fWBI < Pre-fWBI. Blue areas in the cuneate cortex and prefrontal cortex exhibited less metabolic activity in scans obtained 9 months after fWBI than in scans obtained prior to fWBI. Lower panel: post-fWBI > Pre-fWBI: the red areas in the cerebellum and thalamus exhibited greater metabolic activity in scans obtained 9 months after fWBI than in scans obtained prior to fWBI. The color bar is the degree of intensity difference shown as a scale of t values with P <0.001. Adapted from Robbins et al. (2012).

