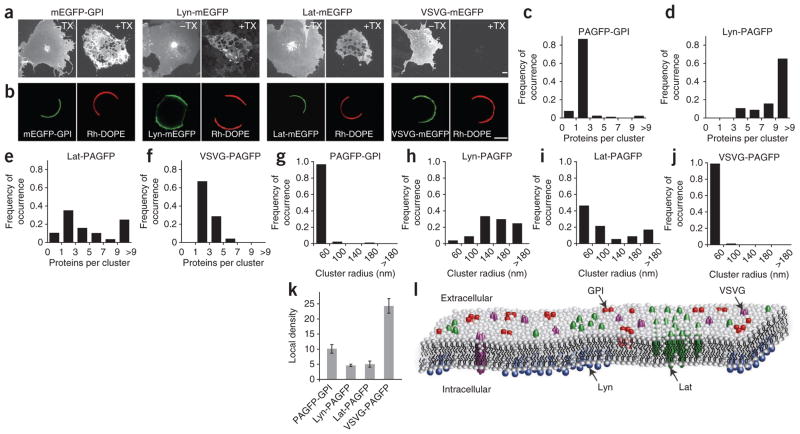
Figure 3.
Steady-state spatial distribution of plasma-membrane proteins assessed by PC-PALM. (a) Maximum-intensity projection confocal images of mEGFP-labeled proteins expressed in COS-7 cells. mEGFP-GPI, Lyn-mEGFP, Lat-mEGFP and VSVG-mEGFP were uniformly distributed across the plasma membrane (–TX). On extraction with 1% Triton X-100 at 4 °C (+TX), mEGFP-GPI, Lyn-mEGFP and Lat-mEGFP were present in detergent resistant membrane, whereas VSVG-mEGFP was solubilized. Scale bars, 5 μm. (b) Partitioning of mEGFP-labeled proteins and Rh-DOPE between coexisting liquid phases in GPMVs. (c–j) Cluster parameters of steady-state distribution of PAGFP-labeled proteins graphed as proteins per cluster (c–f) and as distribution of cluster radius (g–j) assessed by PC-PALM (n = 91 for PAGFP-GPI, n = 57 for Lyn-PAGFP, n = 88 for Lat-PAGFP and n = 73 for VSVG-PAGFP). (k) Density of proteins in clusters for PAGFP-GPI, Lyn-PAGFP, Lat-PAGFP and VSVG-PAGFP. Error bars, s.e.m. (n = 91 for PAGFP-GPI, n = 57 for Lyn-PAGFP, n = 88 for Lat-PAGFP and n = 73 for VSVG-PAGFP). (l) Model of steady-state spatial distribution of the four proteins based on PC-PALM analysis.

