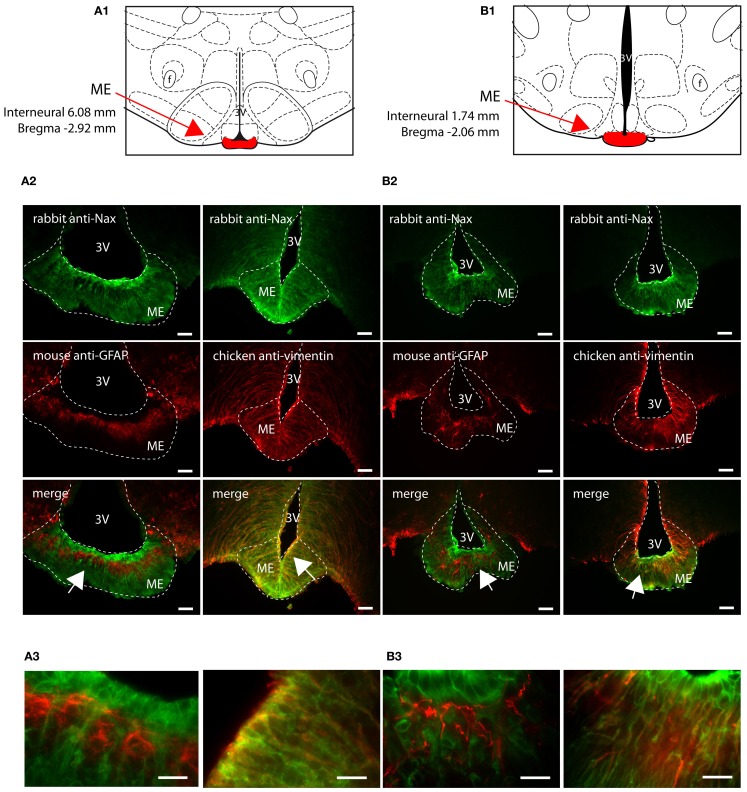
Figure 3.
Distribution of NaX immunostaining in the median eminence of the rat and mouse. Schematic illustration of the median eminence (ME) of the rat (A1) and of the mouse (B1). ME was filled in red for better identification. f, fornix; 3V, third ventricle. Representative picture of the fluorescent NaX immunostaining (green) was obtained from the rat (A2) and from the mouse (B2). The cell type expressing NaX was identified using anti-GFAP and anti-vimentin fluorescent immunostaining (red). Scale bar: 100 μm. The arrow head points the top-right, the bottom-right, and the bottom-left corner of the inset, which represents a high magnification zone of the ME in the rat (A3) and in the mouse (B3); scale bar: 20 μm. Note that NaX staining is present in vimentin positive cells.

