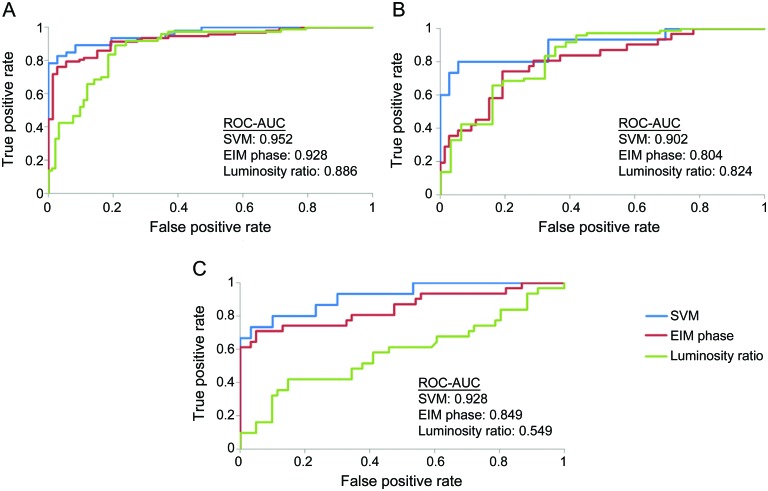
Figure 2. Receiver operating characteristic (ROC) curves for support vector machine (SVM) model.
ROC curves show the classification performance of the SVM model in comparison with the performance of key electrical impedance myography (EIM) and ultrasound measures for (A) normal vs spinal muscular atrophy (SMA) classification, (B) normal vs type 3 SMA classification, and (C) type 2 SMA vs type 3 SMA classification. AUC = area under the curve.

