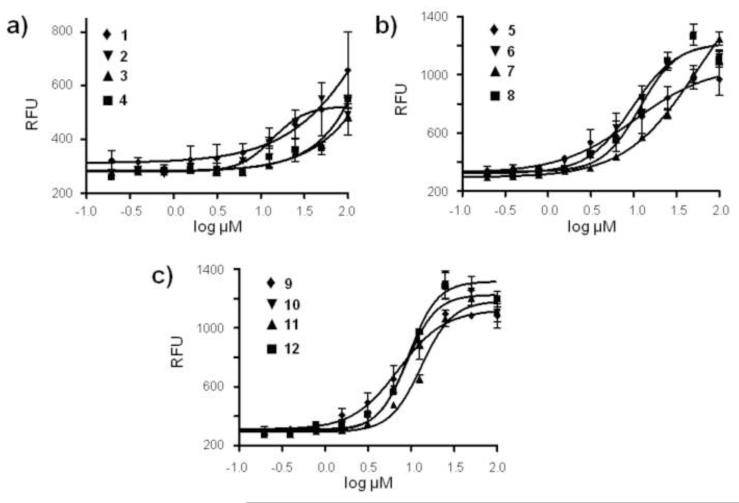
Figure 4.
Uptake of CAM into MDCKII-MDR1 cells as a function of concentration of thiorhodamines 1-4 (Panel a), 5-8 (Panel b) and 9-12 (Panel c). Values of IC50 (Table 1) were determined by a sigmoidal dose-response (variable slope) analysis. Data represent the average and standard error mean for triplicate measurements.

