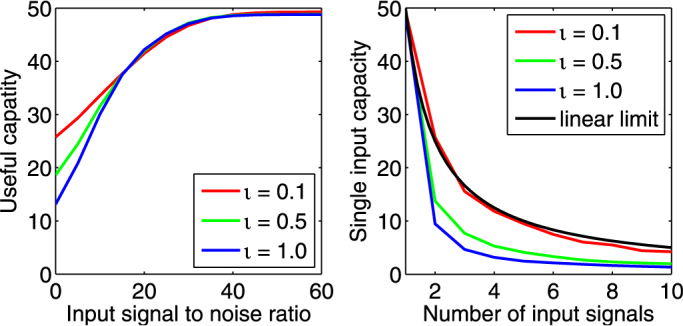
Figure 4. Decrease of total capacity CTOT due to noise, for an ESN with ρ = 0.95, for different values of ι, corresponding to varying degree of nonlinearity.

In the left panel there are two i.i.d. inputs, the signal u and the noise v. The horizontal axis is the input signal to noise ratio in dB ( ). The fraction of the total capacity which is usable increases when the SNR increases, and decreases when the system becomes more non-linear (increasing ι). In the right panel there are a varying number K of i.i.d. inputs with equal power, the total power being kept constant as K varies. The capacity for computing functions of a single input in the presence of multiple inputs is plotted. The black line indicates the situation for a strictly linear system, where the capacity for a single input should equal N/K.
