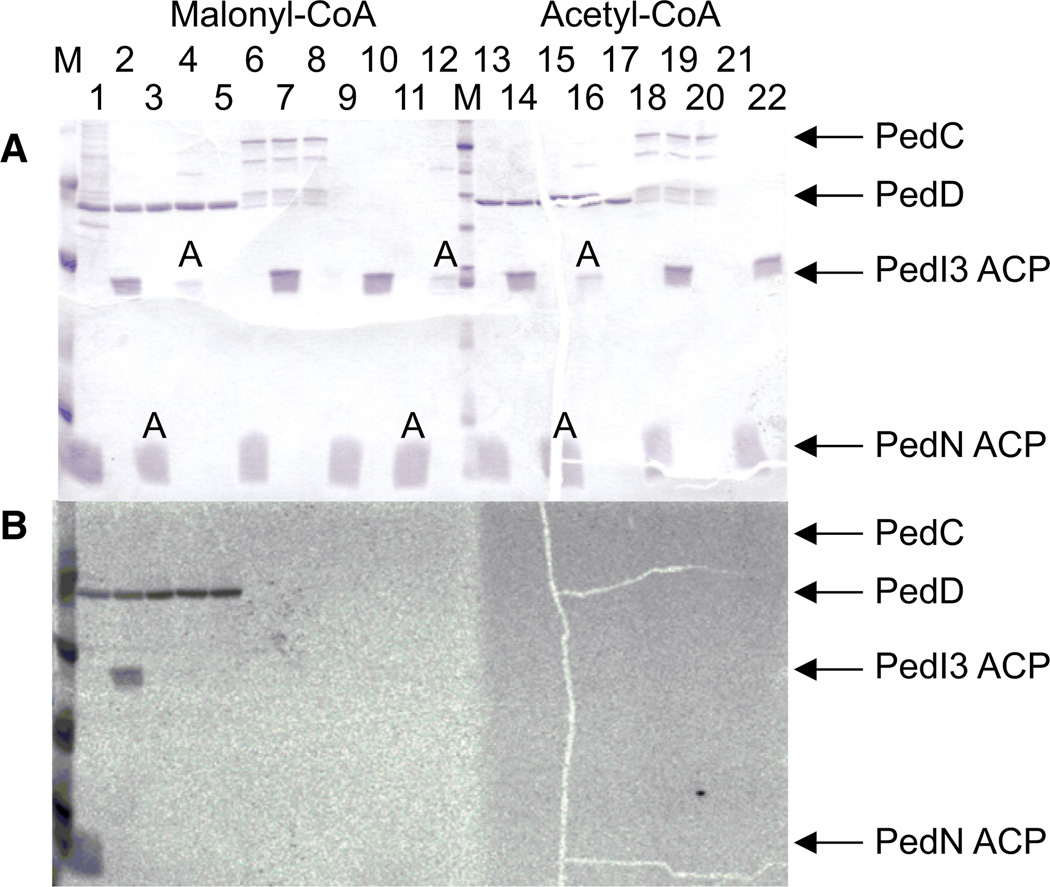
Figure 4. Acyltransferase Assay Using the Pederin ATs.
(A) SDS-PAGE analysis of incubations containing PedD (lanes 1–5, 13–17) or PedC (lanes 6–8, 18–20), radiolabeled malonyl-CoA (lanes 1–12) or acetyl-CoA (lanes 13–21), and the ACPs of PedI3 (tandem ACP) or PedN. ACPs were in the holo form or the apo form, the latter indicated by an A. Protein markers are indicated with an M.
(B) Autoradiogram of the same gel. See also Figure S2.

