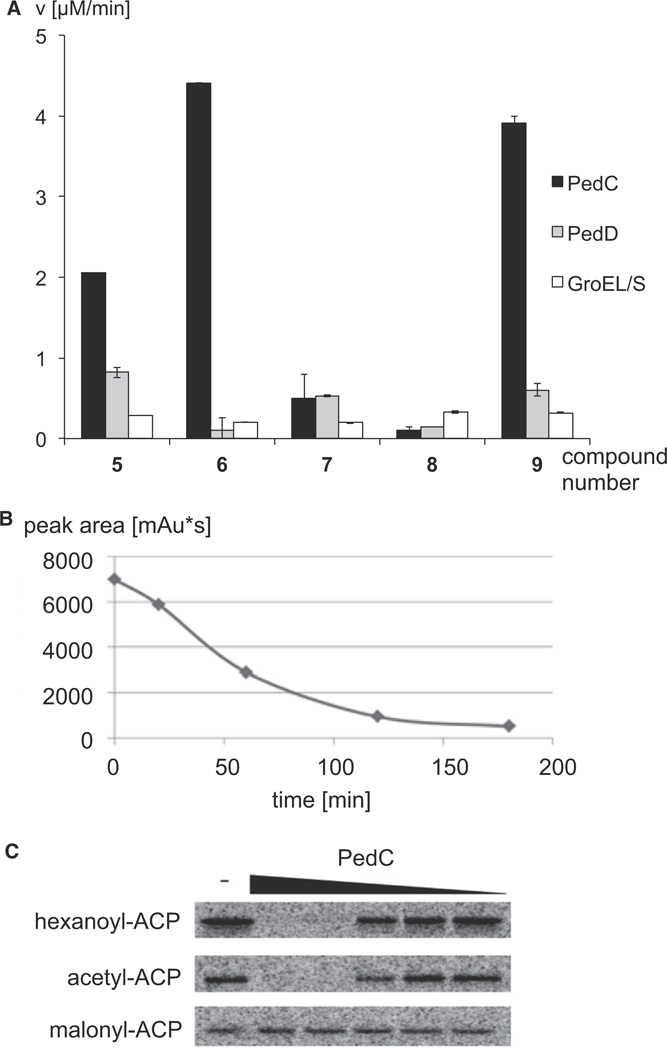
Figure 5. Hydrolysis Assays Using Acyl-SNAC and -ACP Test Substrates.
(A) Reaction rates observed for various SNAC derivatives. Error bars specify standard deviations.
(B) Consumption of hexanoyl-SNAC by PedC. After treatment of the thioester with PedC, aliquots were removed and separated by HPLC. The diagram shows the amount of hexanoyl-SNAC determined by manual integration at 232 nm at different reaction time points.
(C) Phosphor image of PksA acyl-ACP hydrolysis assays with PedC. The signal is emitted from radiolabeled acyl-ACP after electrophoretic separation of proteins. Acyl-ACP (10 µM) was treated for 10 min with 0 (minus sign indicates negative control), 5, 0.83, 0.14, 0.023, or 0.005 µM PedC. See also Figures S3 and S4.

