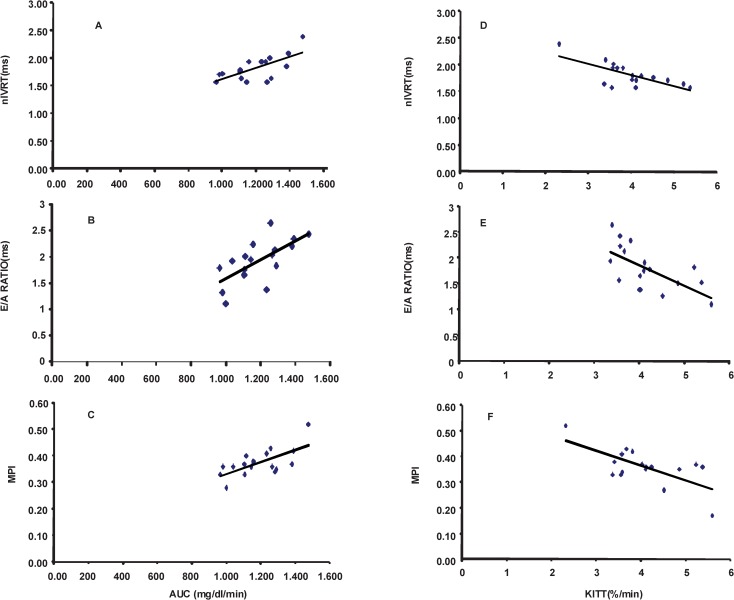
Figure 2.
Correlation analyses between insulin resistance index, diastolic index and global index. A: normalized isovolumetric relaxation time (nIVRT), B: ratio of maximal early diastolic peak velocity (E) and late peak velocity (A) of mitral flow (E/A ratio), C: myocardial performance index (MPI) vs. area under the curve of the rate constant for blood glucose disappearance (AUC) and D: nIVRT, E: E/A ratio and F: MPI vs. the rate constant for blood glucose disappearance (KITT), involving control, fructose-fed and trained fructose-fed rats.

