Abstract
Previous work examining the effect of vehicle mass has demonstrated the link with occupant injury severity. The principal factor has been related to Newtonian mechanics. This paper analyses data from the UK Co-operative Crash Injury Study and identifies other factors associated with car size. The mass of the car is found to have a predominant effect on injury outcome in frontal collisions only where the effect is seen most in injuries to the head, face and chest. Most fatal casualties in small cars die when in collision with another car in front or side collisions while the key group for large cars is frontal collisions with road-side objects. There are several characteristics of small car occupants that differ from those in large cars including gender, age and vehicle occupancy. New information in the analysis concerns the priorities in casualty reduction between small and large car occupants and the paper argues that vehicle design should take account of this variation to produce vehicles optimised for the complete range of crashes and car occupants.
Previous work examining the effects of car size on the safety performance of the vehicle has largely concentrated on the relationship between vehicle mass and fatality rate. Many analyses of real world crash data have substantiated the physical theory that the risk of death and serious injury increases in car to car crashes as car size decreases. (Joksch, 1976; Thomas et al 1990; UK Department of Transport, 1993, 1995; Boehly and Lombardo, 1980; Nygren et al, 1982; Evans, 1984, 1985, 1987).
Boehly and Lombardo found an increase of up to eight times in the fatality risk for occupants between the smallest and largest cars in the US. Evans, also in the US examined FARS data and noted a twofold increase in the fatality risk when the car mass was reduced from 1600kg to 900kg while Nygren in Sweden found that drivers of 800kg vehicles were twice as likely to be injured as drivers of 1400kg. vehicles. The mass effect has also been shown to be important in single vehicle accidents (Grime and Hutchinson, 1983). More recently Evans (1996) has demonstrated that the increase of fatality rates amongst small car occupants is causally related to the mass effect of Newtonian mechanics.
Studies on the effect of vehicle mass have almost exclusively been based on field data that did not contain details of the injury patterns. The influence of car size on the nature and distribution of injuries has seldom been evaluated. Similarly there is little data that examines the effect of collision type, in a frontal impact the occupants are initially seated remote from the impact point and there is sufficient spatial and temporal opportunity for the car mass to influence injury outcome. In side impacts the injuries of struck-side occupants are normally sustained at an early point in the crash phase before the final deformations are achieved and when the total mass of the car has not experienced loads. It would be surprising if mass showed the same relation with injury outcome in side impacts as in frontal collisions. Cars of different sizes may not have the same geometric properties which may influence the manner in which they interact with other cars. Hartemann (1979) has reported that the height of the energy absorbing structures rises as car size increases thus small cars may be at a disadvantage in side impacts where loads may be applied above the sill.
Another consideration concerns the manner in which cars are used by the occupants and the traffic environments in which they are used. Manufacturers identify many target purchasing groups for marketing purposes and the group of small car purchasers may have quite different characteristics from those in larger cars. If there are variations in the traffic environment then this could have implications for the crash configurations and the collision severities involved.
Finally there is a growing recognition of the importance of designing cars for the conditions in the real-world rather than purely for stylised experimental situations. Legal requirements represent the minimum standards but Thomas (1997) has shown that current test procedures do not fully represent the range of crash conditions and characteristics of users experiencing real-world collisions. It is increasingly important to optimise the performance of cars for the complete range of crash conditions and this will necessarily have to take account of variations between large and small car crashes.
CRASH INJURY DATA SAMPLE
The data collected within the UK Co-operative Crash Injury Study was used to investigate the effects of car size on injuries. The entry criteria for the sample analysed were that the cars were towed from the crash scene, they were aged 7 years or less at the time of the crash and at least one of the car occupants had been injured. The data was collected from the East and West Midlands within the UK by teams at Loughborough and Birmingham Universities. A stratified sampling system was used to select cases for investigation and the data was then weighted using the STAIRS protocol (Ross et al 1998) so as to be representative of the towaway population of cars aged seven years or less. The crashes all occurred between 1996 and 1998.
The data presented in this paper are weighted to give the population estimates. The size of the unweighted sample is also given with each table.
TRENDS IN CAR MASS
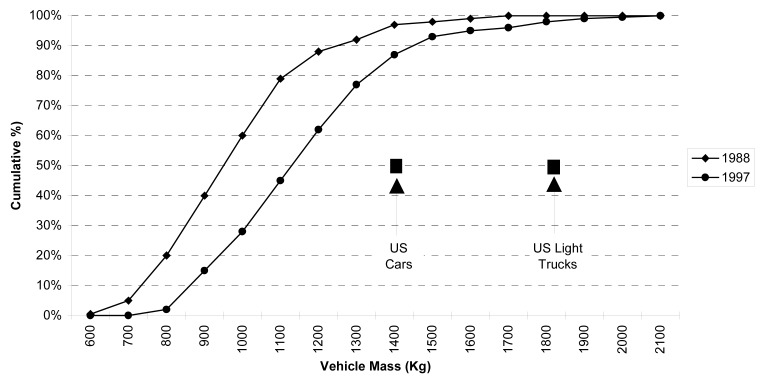
Environmental considerations are strong within Europe and there is a continued pressure to reduce the natural resources that are used to manufacture and use vehicles. The desire for improved fuel efficiency is combined to minimise the materials and reduce the mass of new vehicles. Against this is the influence of demand for higher levels of safety. The overall effect has been for the median mass of passenger cars sold in the UK to increase from 950 Kg in 1988 to 1135 in 1997 (Figure 1) (Rogers, 1998). The figure also shows the median masses for US cars and light trucks sold in 1997 (Green 1997).
Fig. 1.
Mass of New Cars Sold in UK
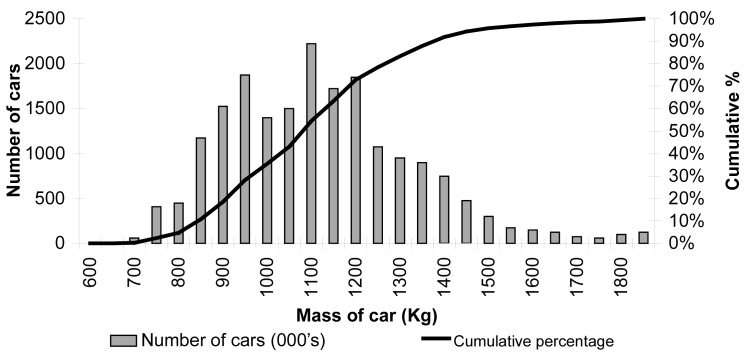
One factor that determines injury outcome is collision severity which is in itself dependent on the ratio of the masses of vehicles in a two-car collision. The distribution of the masses of passenger cars in the UK fleet is shown in Figure 2 (Rogers, 1998). Although the masses range from 700 kg to above 1850 Kg giving a maximum mass ratio of 2.6 most cars on the road have masses clustering around the median. In fact 69% of cars have a mass between 950 Kg and 1350 Kg resulting in a mass ratio range between 0.7 – 1.42.
Fig. 2.
Mass Distribution of UK Car Fleet
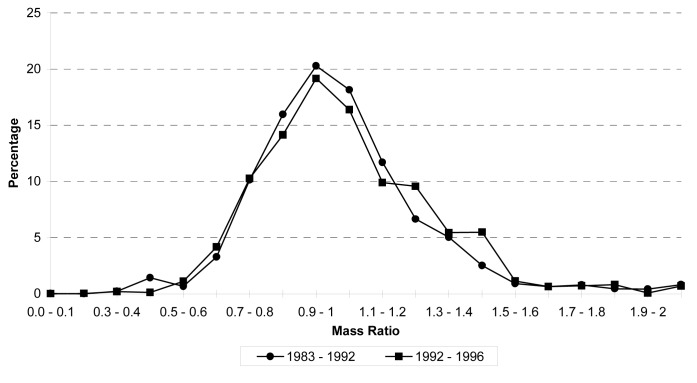
Lie (1998) has shown that as the spread of masses in the car fleet increases so does the risk of fatality in car to car collisions. As the spread increases there is a greater opportunity for adverse mass ratios that result in higher collision severities for one of the cars. Figure 3 compares the distributions of the mass ratios of car to car crashes within the CCIS data during the two periods 1983 – 1992 and 1992 –1996. The standard deviation of the two distributions was 0.31 for the earlier period and 0.28 for the later one and the data does not support a change in distributions between the two periods.
Fig. 3.
Mass Ratio Distribution
DIMENSIONS OF CARS
While the mass of a car is the most commonly used measure it is not the only one that might relate to road user protection. Another common classification is that of vehicle class. This categorisation does describe the size of the vehicle but other factors such as position within the market and standard equipment also may affect the class. The dimensions of the vehicle provide indications of the crush distance available for front and side impacts and the wrap around distance for pedestrian contacts. Table 1 shows the median dimensions of each class of car. The median values of the length of the car and the length of the bonnet vary by 48% while the width of the car and the door thickness increase by 19% and 33%.
Table 1.
Dimensions of each car class
| Median Values | A-class | B-class | C-class | C/D-class | Larger |
|---|---|---|---|---|---|
| Overall Length (cm) | 315 | 363 | 411 | 445 | 467 |
| Bonnet length (cm) | 99 | 115 | 126 | 141 | 147 |
| Vehicle Width (cm) | 143 | 155 | 165 | 166 | 170 |
| Door Depth (cm) | 10.5 | 12.5 | 14 | 14 | 14 |
| Example | Fiat Cinque- cento | Opel Corsa | Ford Focus | VW Passat | BMW 7 Series |
The width of the car and the space allocated to door thickness are the result of packaging and manoeuvrability considerations as well as of safety. Vehicles of C-class and larger show little real increase in width and door crush space.
A key feature relating to the interaction between cars is the location of the structural elements. In particular the height of the energy absorbing beams at the front of the car and the sills at the side are important for side impact protection. If the heights of the structures are such that they will engage in a collision then loads can be transmitted through paths away from the occupants. To evaluate the effect of car size the locations of the structural elements were measured for 198 current production vehicles. The measurements taken are illustrated in Figure 4. Some of the vehicles measured had the top and bottom of the longitudinals at different heights from the bumper, in this case the bumper was ignored and the true measurement recorded.
Fig 4.
Measurements of front and side structures
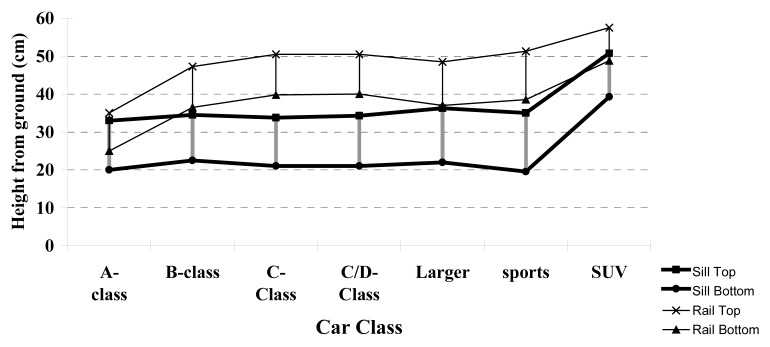
The median positions of the tops and bottoms of the longitudinals are shown in Figure 5 together with the positions of the structural elements of the sills. There was little variation of the sill or longitudinal heights between most of the groups of cars. Cars of B-Class and larger all typically had the lowest part of the longitudinal between 35 and 40 cm from the ground. The same vehicles had the highest part of the sill below 35cm from the ground. In a two car collision between cars of B-Class or larger there was little opportunity for the structures to engage materially. The exceptions were the two groups at the extremes of the range. A-Class cars had the sill and longitudinals at similar heights - between 25 and 35cm from the ground. A large overlap of structures would be observed if two such cars collided. Sports Utility Vehicles had structures high from the ground and higher than those of other cars. Typically the longitudinal was above 48cm and the sill top below 52cm from the ground. While some engagement of structures would be likely when two SUVs were in collision a considerable mismatch would be expected were an SUV to strike a car.
Fig. 5.
Sill and Longitudinal Heights -199 Current Production Cars
CRASH TYPE
Car manufacturers aim to match the specifications of car models with those of the market segment the model is aimed at. Different market segments are likely to have different patterns of use and hence different crash characteristics. The CCIS data has been examined to identify variations in crash type for different sizes of car. For this analysis cars are categorised by mass with small cars representing the lightest 25% (below 950Kg) and large cars constituting the heaviest 25% (above 1250Kg).
CRASH DIRECTION AND COLLISION PARTNER
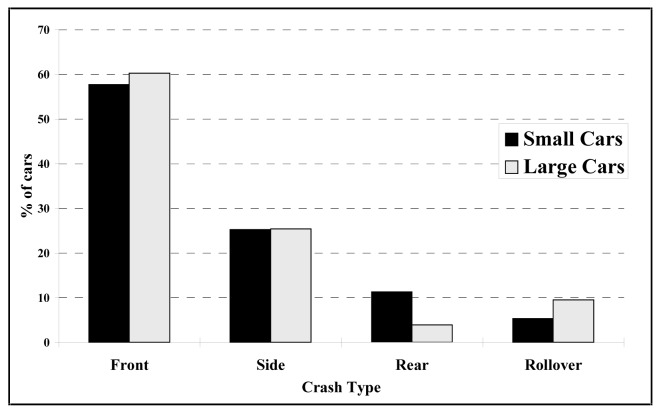
The impact direction of the crash was categorised into front, side, rear and rollover according to the principal direction of force and the surface contacted. The distribution of direction is shown in Figure 6 for the three groups of cars. Small cars were involved in very similar rates of frontal and side impacts but 12% of small cars were involved in rear impacts compared with 4% of large cars. One factor that may influence this result is that smaller European cars are frequently of a hatchback design which means that there is a reduced crush space available before the car becomes undrivable. It is therefore likely that smaller cars in rear collisions will satisfy the towaway selection criterion after lower speed collisions than larger cars which may have a boot.
Fig. 6.
Crash Direction
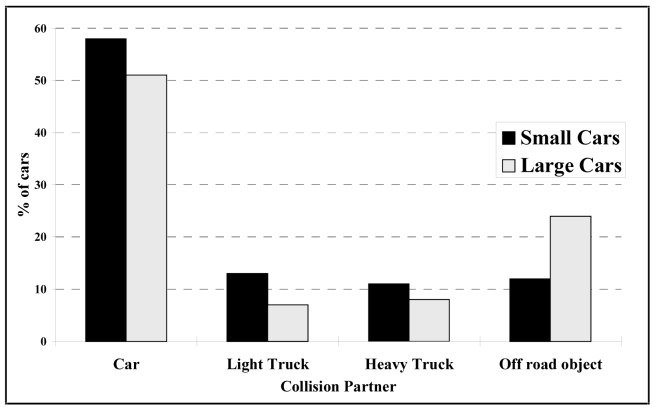
There are clear differences in the nature of the collision partner between small and large cars, shown in figure 7. Small cars were less likely to be in collision with a roadside object such as a tree, road sign or lighting column. They were more likely to be involved in collisions with other vehicles. This difference is a reflection of the greater vulnerability of smaller cars to be in injury causing crashes and also to enter a towaway sample. Another factor though is the road environment in which the cars are used, if large cars are used more on rural roads where travel speeds are higher and there are more trees close to the road then the exposure to conditions of risk is likely to be higher.
Fig. 7.
Collision partner
When crash direction and collision partner are assessed separately, as in figures 6 and 7, it could be concluded that the priorities for both large and small cars are frontal collisions with other cars. However figures 6 and 7 are closer to a measure of exposure as they include all injury severities and the pattern is different when the two parameters are considered together for fatal crashes.
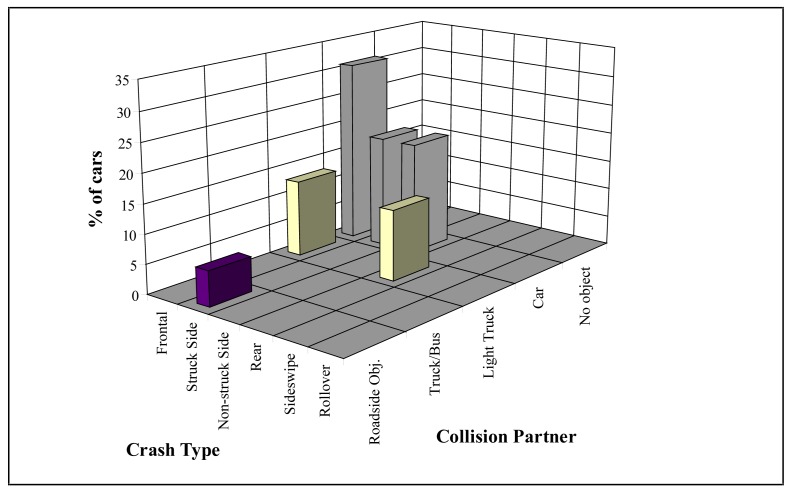
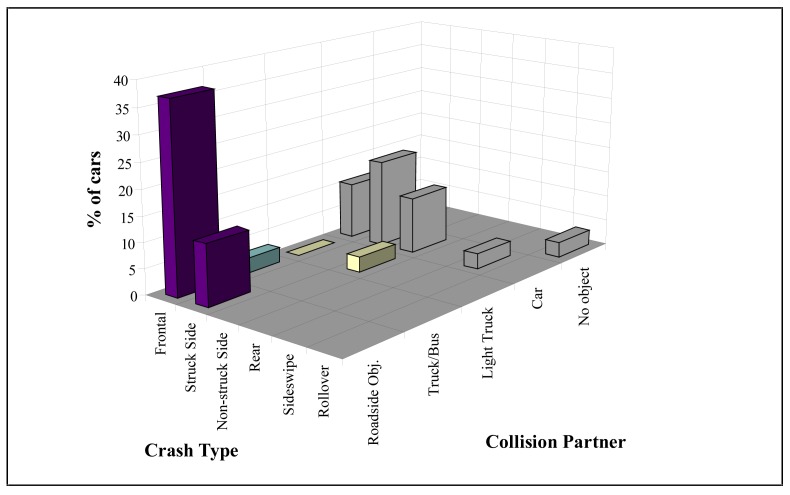
The combinations of collision partner and direction are shown for fatal crashes in Figures 8 and 9. 31% of small car fatalities were killed in frontal collisions with other cars while 37% were killed in car to car side impacts. There were equal numbers of struck-side and non-struck side occupants in this group of side impact fatalities. In large cars only 11% died in frontal collisions with other cars while 28% died in car to car side impacts. Frontal impacts with roadside objects accounted for 37% of fatalities. There were a total of 51 fatal casualties within this recent dataset so the results were compared with older data collected between 1983 and 1992 to assess the robustness of the results. The older data with a total of 350 large and small car fatalities showed similar trends in collision direction and partner giving more credence to the priorities in modern cars.
Fig. 8.
Fatal crashes, Small cars - Collision Partner and Direction
Fig 9.
Fatal crashes, Large cars - Collision Partner and Direction
COLLISION SEVERITY
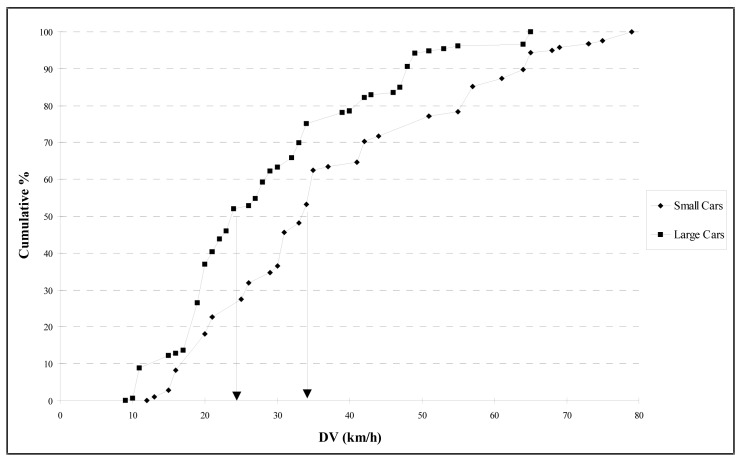
The ratio of the vehicle masses in car to car collisions is an indication of the severity of the collision. Newtonian mechanics indicates that the delta-v is proportional to the ratio of the masses so a heavier collision partner indicates a higher collision severity. Figure 10 describes the collision severity in frontal collisions with other cars as measured by delta-V for small and large cars. The difference between the distribution for each group of vehicles conforms with what might be expected by the differences in mass ratio. The median delta-v for small cars in frontal collisions with other cars was 33 km/h against 24 km/h.
Fig. 10.
Delta-V Distributions
CHARACTERISTICS OF VEHICLE USE AND USERS
The manner in which a vehicle is used partly determines crash related injuries. For example if a vehicle is used for local deliveries in many territories the driver may be exempt from seat belt use requirements and the level of belt use could be low. Similarly if the vehicle is used by a group of people who are particularly vulnerable then the safety requirements may differ from other groups of cars. This is an important consideration when optimisation strategies are under review.
OCCUPANCY
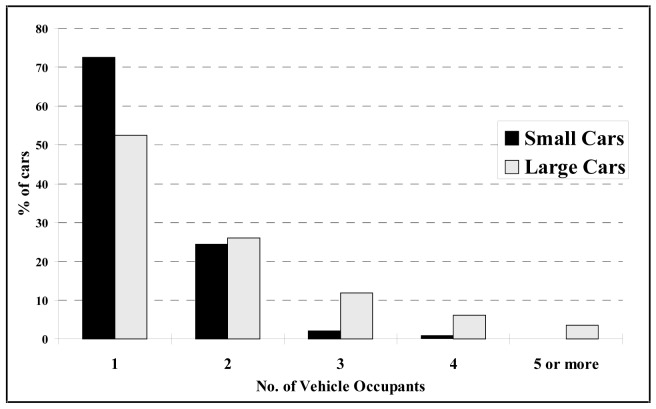
Large differences were observed in the numbers of occupants in each of the sizes of car. Over 70% of small cars only contained one occupant whereas nearly half of the large cars carried two or more. The details are shown in Figure 11.
Fig. 11.
Number of Occupants per Vehicle
Similar proportions of the cars carried two passengers but 22% of large cars carried 3 or more occupants compared with only 3% of small cars.
GENDER
The two classes of car also exhibited differences in terms of the gender distribution of the occupants of each seating position. 80% of the large car drivers were male but 56% in small cars were female. Table 2 shows the distributions for each size category of car. The majority of front passengers of both classes of cars were female but in small cars the rate was 69%. Amongst rear passengers 69% of those in small cars were male compared to 40% in large cars.
Table 2.
Gender Distribution
| Driver | Front Passenger | Rear Passengers | ||||
|---|---|---|---|---|---|---|
| Male | Female | Male | Female | Male | Female | |
| Small Cars | 44% | 56% | 31% | 69% | 69% | 31% |
| Large Cars | 80% | 20% | 40% | 60% | 40% | 60% |
OCCUPANT AGE
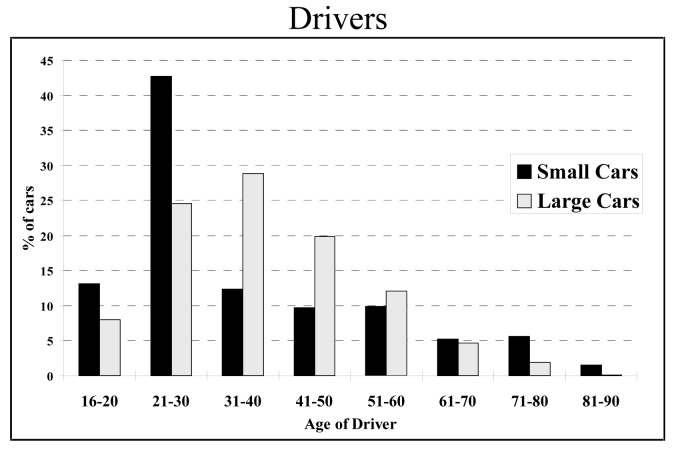
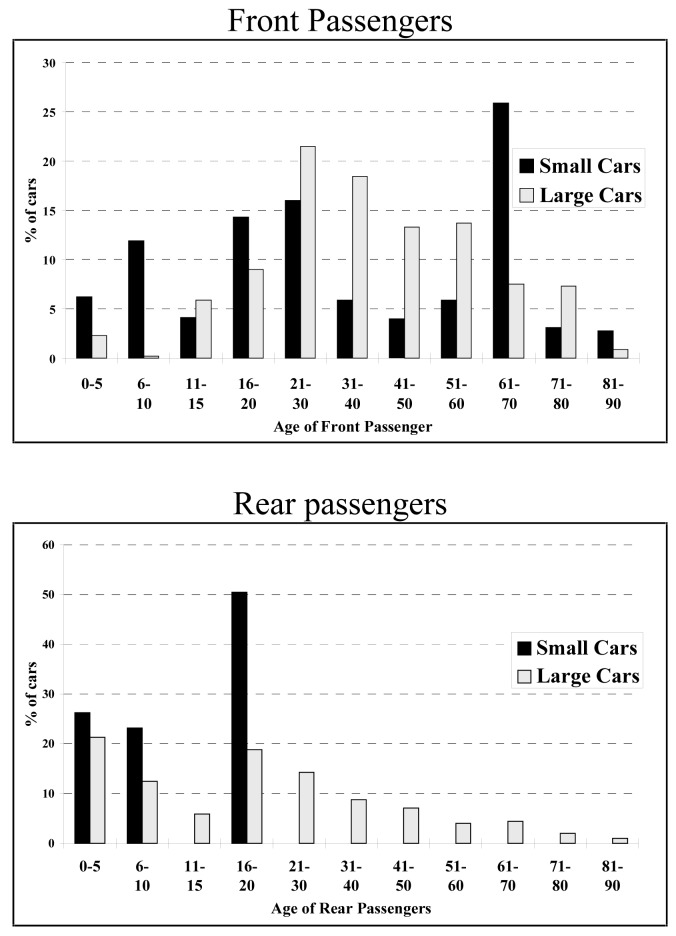
The characteristics of the users also varied between classes of car and between seating position. Drivers of small cars tended to be younger than those in large cars. The median values for small cars was 28 years compared with 37 for large cars and they were similar to those for front passengers of 27 and 36 years respectively. However the age distribution of small car front passengers was bimodal and unlike that for large car front passengers. The three charts in figure 12 show that 32% of the front passengers in small cars were over 60 years old and 37% below 20 compared with 16% and 17% for large cars.
Fig. 12.
Ages of Occupants
Rear passengers also showed a variation, there were none aged above 20 in small cars compared with 42% in large cars. The median ages were 13 in small cars and 16 in large cars.
RESTRAINT USE
Compulsory seat belt use has been in effect for occupants of the front seats of cars in the UK since 1983 and in the rear seats since 1989 for children and 1991 for adults. Since this time restraint use has remained high for the general driving population, at least for front seat occupants. In this sample of crash injury data there were no airbags installed in the vehicles. Table 3 shows the levels of belt use for small and large cars for each seating position.
Table 3.
Belt use
| Driver | Front Passenger | Rear Passengers | ||||
|---|---|---|---|---|---|---|
| Belted | Unbelted | Belted | Unbelted | Belted | Unbelted | |
| Small Cars | 94% | 6% | 97% | 3% | 19% | 81% |
| Large Cars | 89% | 11% | 90% | 10% | 67% | 33% |
In this sample of data high levels of restraint use were observed for the front occupants of both large and small cars. In the rear seating positions of small cars only 19% were restrained compared with 67% in large cars. On road surveys indicate that younger children show high rates of seatbelt use while the rates are lower for teenagers and adults.
INJURY OUTCOMES
Injury outcome can be assessed by fatality rates, injury rates and multiplicity of injuries amongst other measures. An issue of particular interest concerns the location of the injuries. Previous studies, based on mass data rather than in-depth data, have shown that casualties in lighter cars do have higher rates of death and injury compared with heavier cars. However these are generally calculated grouping all impact directions together. Table 4 shows the injury and fatality rates for belted drivers in frontal collisions and struck side occupants in side impacts.
Table 4.
Injury and Fatality Rates
| Belted Drivers in Frontal Collisions | Struck-side occupants | |||
|---|---|---|---|---|
| MAIS | Small Cars | Large Cars | Small Cars | Large Cars |
| 0 | 9% | 19% | 11% | 27% |
| 1 | 65% | 65% | 65% | 47% |
| 2 | 20% | 13% | 17% | 16% |
| 3+ survivors | 4% | 2% | 5% | 6% |
| Fatal | 2% | 1% | 2% | 4% |
Table 4 shows that, when restrained drivers do sustain injuries in frontal collisions, those in smaller cars sustain more severe injuries and have a higher fatality rate. In small cars the rates of MAIS 3+ injuries and fatality were twice as high as in larger cars. In side impacts the pattern was different. Fatalities occurred at twice the rate in large cars as in small cars, MAIS 3+ levels were similar however the group of uninjured casualties was 27% in the larger cars compared to 11% in the smaller vehicles.
The patterns of injury to each body region are shown in Table 5 for restrained drivers in frontal collisions and struck-side occupants in side collisions. 26% of restrained drivers in frontal collisions sustained MAIS 2+ injuries compared with 16% in large cars. This difference was observed for each of the body regions except the lower extremity, head and chest injury rates particularly were reduced in large car drivers.
Table 5.
Injury Patterns - AIS 2+ injuries
| Belted Drivers in Frontal Collisions | Struck-side occupants | |||
|---|---|---|---|---|
| Small Cars | Large Cars | Small Cars | Large Cars | |
| Head/Face | 10% | 3% | 18% | 16% |
| Chest | 12% | 6% | 2% | 11% |
| Abdomen | 6% | 4% | 4% | 5% |
| Arms | 2% | 0.30% | 2% | 8% |
| Legs | 7% | 6% | 5% | 8% |
The opposite pattern occurred in side collisions, the struck-side occupants of large cars generally sustained higher rates of injury to each of the body regions. Only AIS 2+ injuries to the head were more common amongst those in small cars. The greatest difference was observed for chest injuries where 11% of larger car occupants sustained AIS 2+ injuries compared to only 2% in small cars.
DISCUSSION
The relationship between vehicle mass and fatality rates is well known and has been thoroughly documented. Although there may still be some uncertainty as to whether this represents the complete causal relationship this is less important due to the inherent relationship between mass and spatial dimensions with current production materials.
This analysis has shown that the mass of cars in the UK has increased by 20% in the period between 1988 and 1997 and this is in response to increased demands of safety and user comfort. It is likely that pressures for improvements in safety will always be present but this does not mean that car mass will continue to increase. Fashion can change making small cars more popular, increased environmental pressures can have the same effect. There are clear differences across Europe over the preferences of car purchasers with Northern European countries having greater proportions of large vehicles and therefore a different mix of cars within the fleet. Alternatively fashion could increase car masses, if people carriers or sports utility vehicles become more popular then the mass distributions could shift towards heavier vehicles.
The CCIS data has confirmed the finding that lighter vehicles have higher rates of fatality and serious injury in frontal collisions but this has not been observed for side impacts. In frontal collisions the belted drivers of small cars have twice the rate of fatal and MAIS 3+ injuries as those in large cars. The head, face and chests of belted drivers showed the greatest increases in AIS 2+ injuries. In side impacts struckside occupants in large cars had marginally more such injuries particularly to the chest and arms. The series of events in a side impact starts with the exterior and then the interior surfaces deforming. The crush then takes up the space between the occupant and the door. Injuries are sustained when the inner surface of the door strikes the occupant. The movement of the door continues until maximum crush is reached and the vehicle has been accelerated sideways. The mass of the vehicle is only relevant to the eventual change in velocity of the car. The mass of the door and the local side structure are the key elements in examining the effect of mass and the total is far outweighed by the mass of the striking car. It is not surprising that the mass of the car does not have an observable effect on injury outcome in side impacts.
The understanding of the physical principles involved in the issue of car size has concentrated on the effects of mass but the data presented indicates there are other key parameters. One factor that is largely independent of car size, in the European fleet, is the geometric location of car structures. The measurements of front and side structure height indicate there is a considerable degree of mismatch between the front and side structure heights of passenger cars. There is an even greater mismatch between cars and the currently small group of SUVs. However other factors may be more significant for side impact protection and compatibility. Thomas (1989) reviewed the, then proposed, European side impact regulation and concluded that the collision severity of the test procedure was considerably below the typical speed for fatal side impacts. The EU Directive came into force for new vehicles in October 1998 using the previously proposed test velocity.
Manufacturers direct particular car models to specific market segments and groups of car occupants. The CCIS data suggests that these groups do also have specific use characteristics that influence the types of crash and the manner in which the vehicles are used with significant differences between vehicles of different size. Small cars most often are driven by younger women while all cars have women forming the large majority of the front passengers. In small cars these women are often older. This has implications for the design of restraints. Current design practise is to normally place the same performance requirements on both front restraints so targets are the same for driver and passenger dummies. Front passengers of all cars are more at risk of injury under the same circumstances due to the age and gender distribution and the effects of osteoporosis. There would appear to be an opportunity to reduce front passenger casualties by requiring lower loads and taking advantage of load limiters and the increased space available for occupant ridedown. In the same way the data shows that the majority of rear seat occupants are children and this is particularly pronounced in small cars. Yet the legislation concerning rear restraint performance is designed around adults and there has to be adjustabililty built into the restraint or supplementary restraints used to accommodate the needs of children. The basis of the legislation is contradicted by the usage patterns of the vehicles.
Car size also influences the crash type and the priorities for fatality reduction. Small cars are generally exposed to a similar range of collision types as large cars but the protection of the vehicle, related to car mass, means that the outstanding issues are different for large and small cars. The key types of fatal crash involving small cars are principally frontal and side collisions with cars, both struck-side and non-struck-side occupants are equally represented. The priorities for large cars are predominantly frontal collisions with roadside objects followed by side impacts with cars. The difference in priorities for different classes of vehicles is of course a challenge for legislators and manufacturers - there is currently no mechanism that facilitates flexibility over crash requirements for different classes of car even though the priorities may vary. The advantage of safety priorities being driven by real-world data is that it opens the opportunity for vehicle design to be optimised according to the special characteristics of the users and crash types involving that vehicle. Thomas (1997) has shown the importance of user and crash characteristics on injury outcome. Norin (1991) has also shown the consequences of sub-optimisation by failing to take account of real-world variation. This analysis has shown that there is a need to develop optimisation strategies for cars that are based on the specific conditions of use and injury causation of each category of car.
CONCLUSIONS
The mass of a car is a key factor that determines injury outcome.
The size of a car has other implications in terms of the crash characteristics and manner with which it can interact with collision partners.
The priorities for fatality reduction are different for different sizes of vehicle.
There is a need to develop optimisation methods to ensure that the safety benefit of a car applies to complete range of vehicle users for maximum social benefit.
ACKNOWLEDGEMENTS
The Co-operative Crash Injury Study is managed by the Transport Research Laboratory on behalf of the Department of the Environment, Transport and the Regions (Vehicle Standards and Engineering Division) who fund the project with Ford Motor Co. Ltd, Rover Group Ltd., Toyota Motor Europe, Nissan, Daewoo, Honda and Volvo Cars Corporation. The data were collected by teams at the Vehicle safety Research Centre, Loughborough University, The Accident Research Unit, Birmingham University and the Vehicle Inspectorate.
REFERENCES
- Boehly and Lombardo. Small Car Safety. US Department of Transportation, National Highway and Traffic Administration; 1980. [Google Scholar]
- Department of Transport. Cars: Make and Model: Injury Accident and Casualty Rates. 1993. UK Transport Statistics Report. [Google Scholar]
- Department of Transport. Cars: Make and Model: The Risk of Driver Injury and Car Accident Rates in Great Britain. 1995. UK Transport Statistics Report. [Google Scholar]
- Evans L. Driver Fatalities versus Car Mass using a New Exposure Approach. Accident Analysis and Prevention. 1984;16(1):19–36. [Google Scholar]
- Evans L. Fatality Risk for Belted drivers versus Car Mass. Accident Analysis and Prevention. 1985;17(3):251–271. doi: 10.1016/0001-4575(85)90057-0. [DOI] [PubMed] [Google Scholar]
- Evans L, Wasielewski P. Serious or Fatal Injury Rate versus Car Mass in Head-on Crashes between Cars of Similar Mass. Accident Analysis and Prevention. 1987;19(2):119–131. doi: 10.1016/0001-4575(87)90031-5. [DOI] [PubMed] [Google Scholar]
- Green D L. Why CAFE worked. Report for US Department of Energy. DE-AC05-96OR22464
- Grime G, Hutchinson TP. The Influence of Vehicle Weight on the Risk of Injuries to Drivers. Procs. 9th Experimental Safety Vehicle Conference; 1983. pp. 726–741. [Google Scholar]
- Hartemann F, Foret-Bruno JY, Thomas C, Tarriere C, Got C, Patel A. Influence of mass ratio and structural comparability on the severity of injuries sustained by the near side occupants in car to car side collisions. Procs 23rd Stapp Car Crash Conference. [Google Scholar]
- Joksch H.C. Analysis of the future effects of the fuel shortage and increased small car usage upon traffic deaths and accidents. Report DOT-TSC-OST-75-21; 1976.
- Lie A, Tingvall C, Larsson P. The Crash Safety of New Car Models - A Comparative Accident Study of New Versus Old Car Models. Procs. of 15th Enhanced Safety of Vehicles; Melbourne. 1996. pp. 1441–1443. [Google Scholar]
- Norin H, Jernström C, Koch M, Ryrberg S, Svensson S. Avoiding sub-optimised occupant safety by multiple speed impact testing. Experimental Safety Vehicles Congress; Paris. 1991. pp. 1021–1027. [Google Scholar]
- Nygren A, Gustafsson H, Tingvall C. Injury Frequency and Injury Panorama Among Driver - A Comparison between Small and Big Cars and the Influence of Year Model and Production Start. Procs. IRCOBI Conference; Cologne. 1982. pp. 30–39. [Google Scholar]
- Rogers I. Rover Group Internal Report. May, 1998. Development of Criteria and Standards for Vehicle Compatibility. [Google Scholar]
- Ross R, Thomas P, Sexton B, Otte D, Kossman I, Vallet G, Martin J-L, Laumon B, Lejeune P. An approach to the standardisation of accident and injury registration systems (STAIRS) in Europe. Enhanced Safety of Vehicles Conference; Windsor. 1998. pp. 1298–1305. [Google Scholar]
- Thomas P, Bradford M. Side Impact Regulations - How do they relate to real-world accidents. Experimental Safety Vehicles Conference; Gothenburg. 1989. pp. 919–929. [Google Scholar]
- Thomas C, Faverjon G, Henry C, Le Coz JY, Got C. The Problem of Compatibility in car-to-car collisions. Proc. 34th Association for the Advancement of Automotive Medicine; Scotsdale. 1990. pp. 253–267. [Google Scholar]
- Thomas P. Strategies to Optimise Car Safety for Real-world Collisions. Procs IRCOBI Conference; Hanover. 1997. pp. 357–370. [Google Scholar]


