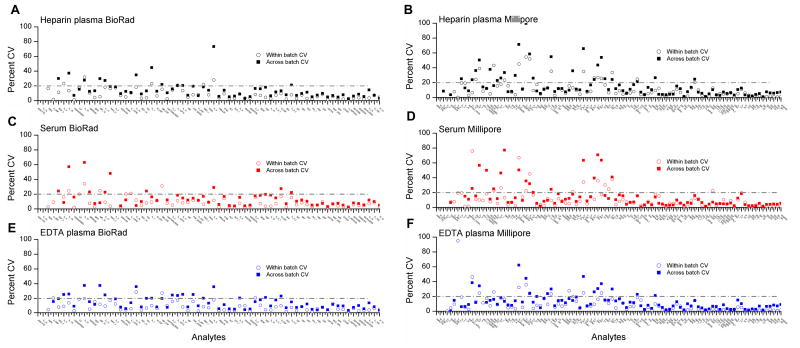
Figure 2. Coefficients of variation in blinded duplicate samples stratified by specimen type and kit.
Figures 2 shows the coefficient of variation (CV) for 40 blinded duplicates, 20 placed within the same batch and 20 placed across different batches. Results are shown separately for 67 Bio-Rad markers (panels A, C, and E) and 97 Millipore markers (panels B, D, and F) across three specimen types—serum, heparin plasma, and EDTA plasma.

