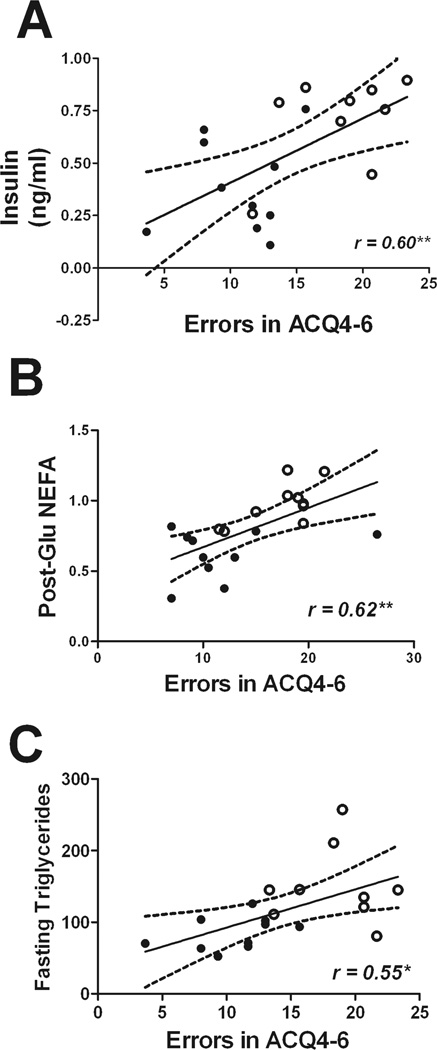
Figure 3. Parameters of insulin resistance and serum triglycerides correlate with maze performance in mice.
Scatter plots show the statistically significant linear relationship between errors in acquisition trail block 4–6 (errors in ACQ4–6) and (A) fasting insulin, (B) circulating NEFA 60 minutes following oral glucose administration (Post-Glu NEFA), and (C) fasting triglycerides in vehicle- and lopinavir/ritonavir-treated mice. Each point represents an individual subject, and closed circles depict vehicle-treated mice while open circles depict lopinavir/ritonavir-treated mice.

