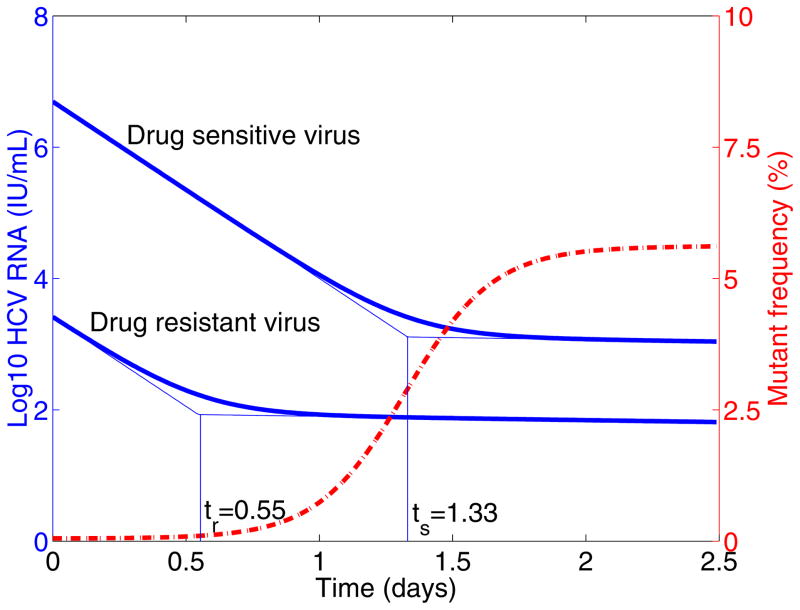
Figure 2. Mutant frequency and virus dynamics after treatment.
The target cell level is assumed to be the pre-treatment steady state T0. Thick solid line is the viral load and dashed line is the mutant frequency after therapy. ts is the time at which the second-phase decline of wild-type virus begins, and tr is the time at which the second-phase decline of drug resistant virus begins. Model parameters are: c = 6.2 day−1 [34], δ = 0.14 day−1 [34], μ = 10−4 per copied nucleotide [33], εs = 0.9997 [38], the Hill coefficient is h = 2 [69]. We assumed the mutant, for example T54A, confers 12-fold resistance and
 /
/
 =0.81 [23]. We obtained the eigenvalues λ1 = −6.2, λ2 = −0.14, λ3 = −6.2048, λ4 = −0.1352, and ts = 1.33 day, tr = 0.55 day.

