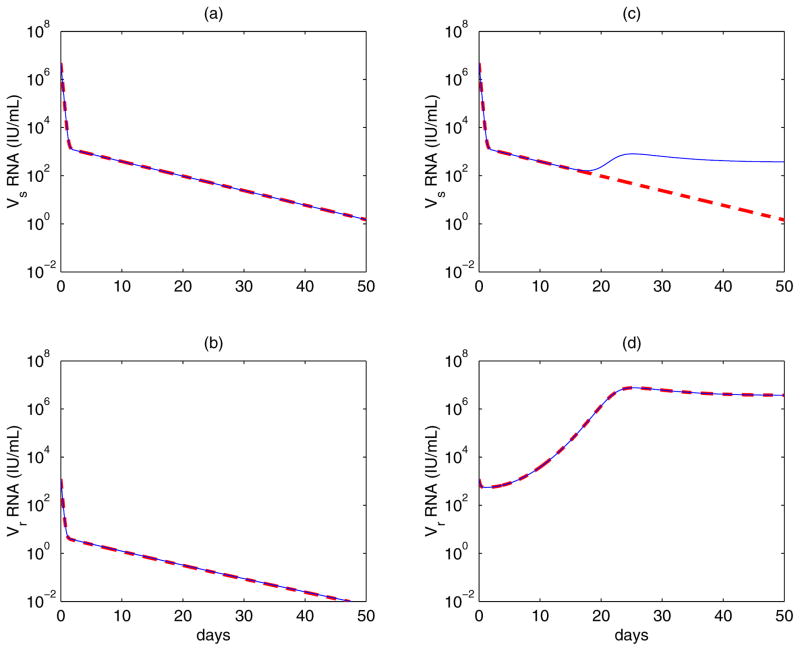
Figure 4. Contribution of mutation to the dynamics of wild-type and drug-resistant virus during treatment.
Assuming there is no mutation during treatment (thick dashed line) and there exist both forward and backward mutations during therapy (thin solid line). Left column: assuming the mutant confers 3.5-fold resistance and
 /
/
 =0.98 [23]. The solid and the dashed lines almost overlap, which suggests that mutation has a negligible effect on the evolution of both strains when the mutation confers a low level of drug resistance. Right column: assuming the mutant confers 466-fold resistance and
 /
/
 =0.45 [23]. Mutation still does not contribute much to the evolution of drug-resistant virus, which emerges and dominates the virus population. However, wild-type virus is maintained at a low level by backward mutation rather than being completely suppressed. The values of parameters used are [26, 34]: s = 7.5× 10⁵ cells mL−1 day−1, d = 0.01 day−1, βs = βr = 10−7 mL day−1 virions−1, μ = 10−4 per copied nucleotide, c = 6.2 day−1, δ = 0.14 day−1, ps = 10 virions cell−1 day−1, εs = 0.9997, and h = 2.

