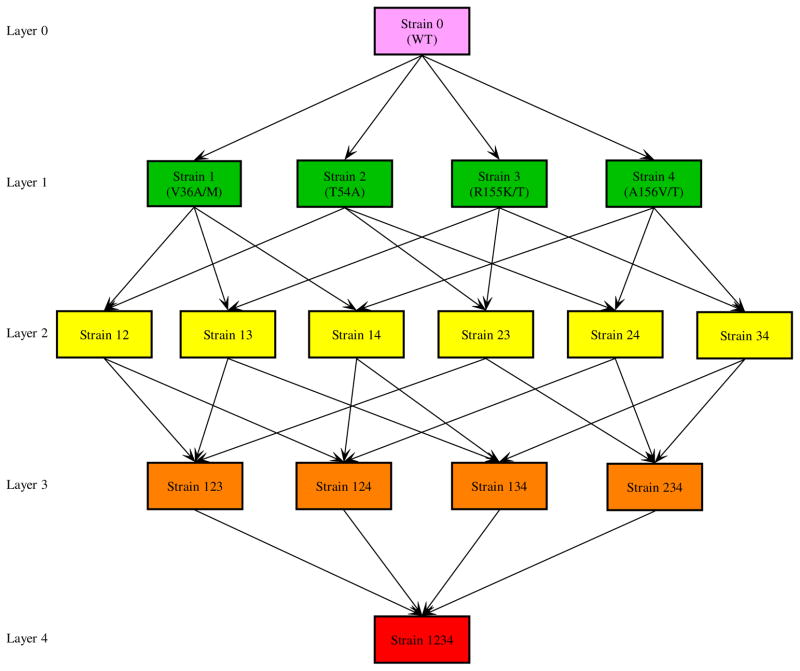
Figure 5. Mutation diagram.
From the topmost (layer 0) to the bottommost (layer 4) are the wild-type, single-mutant, double-mutant, 3-mutant, and 4-mutant strains. Backward mutation is not considered. Mutations between strains that lead to transitions beyond one layer are not shown but are considered in the multi-strain model. For example, the mutation from the wild-type (layer 0) to strain 12 (layer 2) or strain 123 (layer 3) is not plotted in the diagram.

