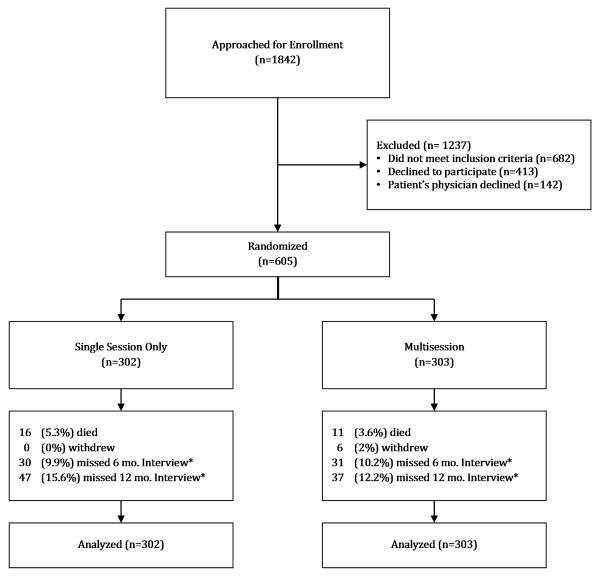
Figure 1.
Flow diagram of progress through the study. Footnote at bottom of Figure 1:
*Response rates for the 6 and 12 month interviews differed by literacy group with lower literacy participants more likely to miss the interview (for example, at 12 months, response rate for low literacy was 80% and for higher literacy 90%). However, the difference in response rates by literacy was not different between the study groups.

