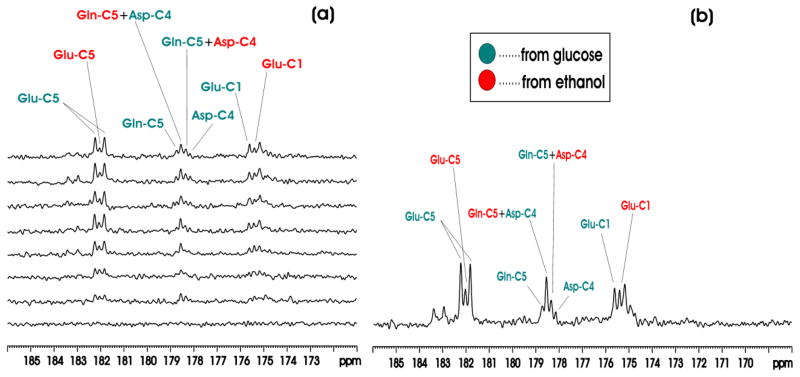
Figure 5.
(a) Time-course 13C MRS spectra from an individual rat brain during intragastric co-administration of [1-13C]ethanol and [13C6]-D-glucose. Each individual spectrum was averaged for 20 minutes. The bottom spectrum was the baseline. (b) Accumulated in vivo 13C MRS spectra from an individual rat brain during intragastric co-administration of [1-13C] ethanol and [13C6]-D-glucose. The spectrum was summed during the 140~360 minute interval after the start of the co-infusion. Green: resonance lines originated from [13C6]-D-glucose; Red: resonance lines originated from [1-13C]ethanol. Data processing parameters were: lb = −5, gb = 0.1.

