
Fig. 1. Distribution of pairwise L1 nucleotide sequence comparisons of 189 Papillomaviruses.
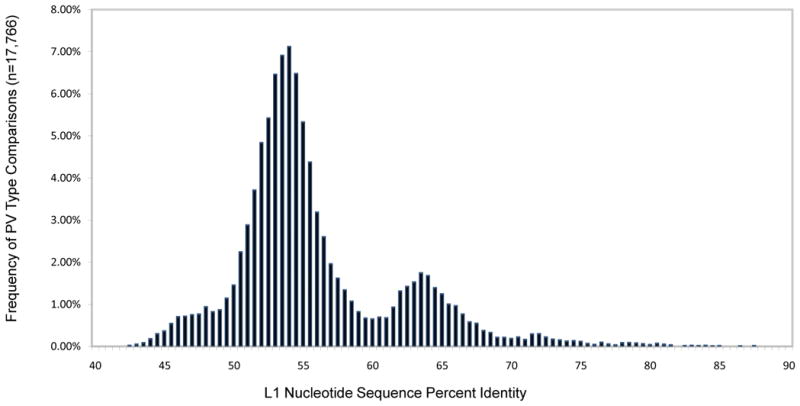
L1 nucleotide global multiple sequence alignments were guided by amino acid alignment using MUSCLE v3.7 (Edgar, 2004) and Seaview v4.1 (Galtier et al., 1996) software. A matrix of 189 L1 regions compared to each other, resulted in a total of 17766 percent identity values. Gaps were included and counted as one position. The Y-axis represents the percent of the total number of comparisons. The X-axis shows the L1 nucleotide sequence percent identity. The figure has a predominantly bimodal distribution with overlap at around 60% nucleotide sequence identity.