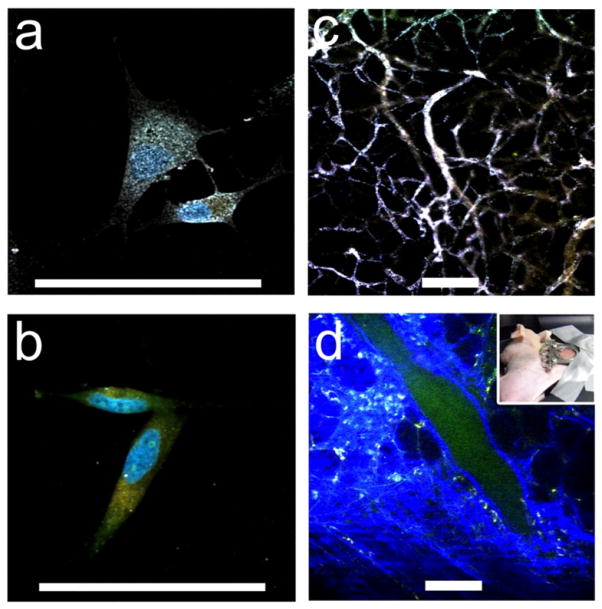
Figure 4.
((a), (b)) TPL imaging of nanostars S30, WGA-coated (a) versus PEGylated control (b), on BT549 cancer cells. WGA-nanostars labelled cells excited under 1% transmission at 800 nm showing preferential cell membrane binding. The blue and orange colours were from Hoescht 33342 and FM 1-43FX dyes respectively. The white colour of nanostars indicates a composite of similar intensities from three different detector channels. ((c), (d)) TPL imaging through a dorsal window chamber (inset) on a nude mouse. (c) With nanostars, tissue vasculature was visible under 5% transmission with minimal background fluorescence. (d) Without nanostars, it required 20% transmission to see vessels. The blue and green colours were from the collagen and blood. Scale bar: 100 μm.

