
Figure 2.
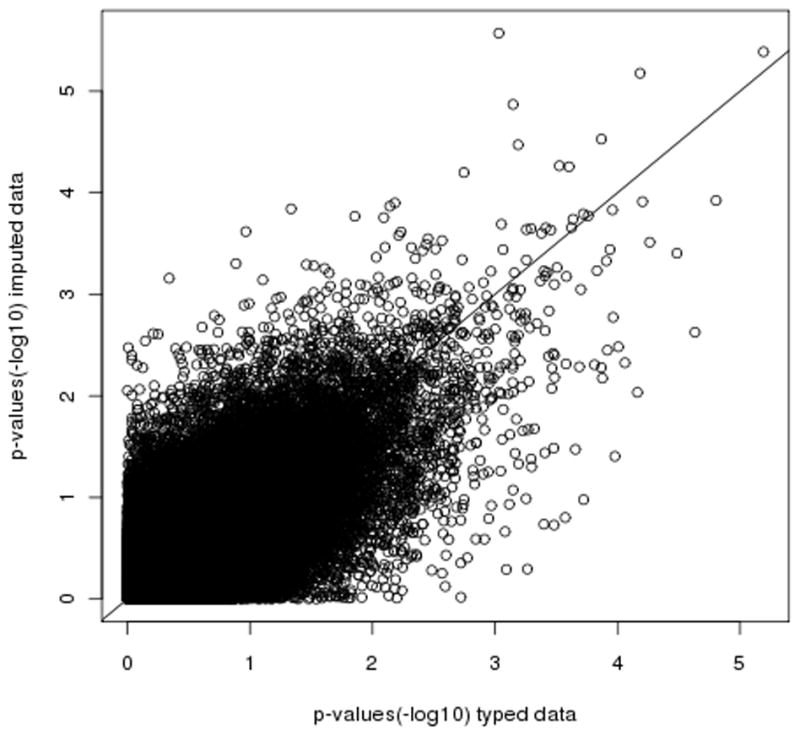
Observed versus expected association minus log 10 p-values at 103,977 SNPs across the genome in simulated null data sets over 909 samples of the combined data set. We observe r2 of 0.64 between p-values computed in typed versus imputed data, similar to simulations of association statistics at imputed versus genotyping calls (Supplementary Note). Results for alternate hypothesis of association can be found in Supplementary Note.